


GSK plc (GSK) advanced 1.67% today, driven by strong intraday buying momentum and bullish technical signals. The price surge is being supported by sustained pressure above short- and medium-term moving averages, though longer-term resistance remains in place below the 200-day average.
 1921.00
1944.00
Highlights
- Shares of GSK trade above short- and medium-term averages but remain below the 200-day threshold at GBX1,954.
- Technical indicators are mixed, with bullish MACD and positive intraday Bull/Bear Power, but weak trend strength and neutral oscillators.
- GSK stock is forecast to trade between GBX1,858 and GBX1,973 over five sessions, with a 64% probability of an increase.
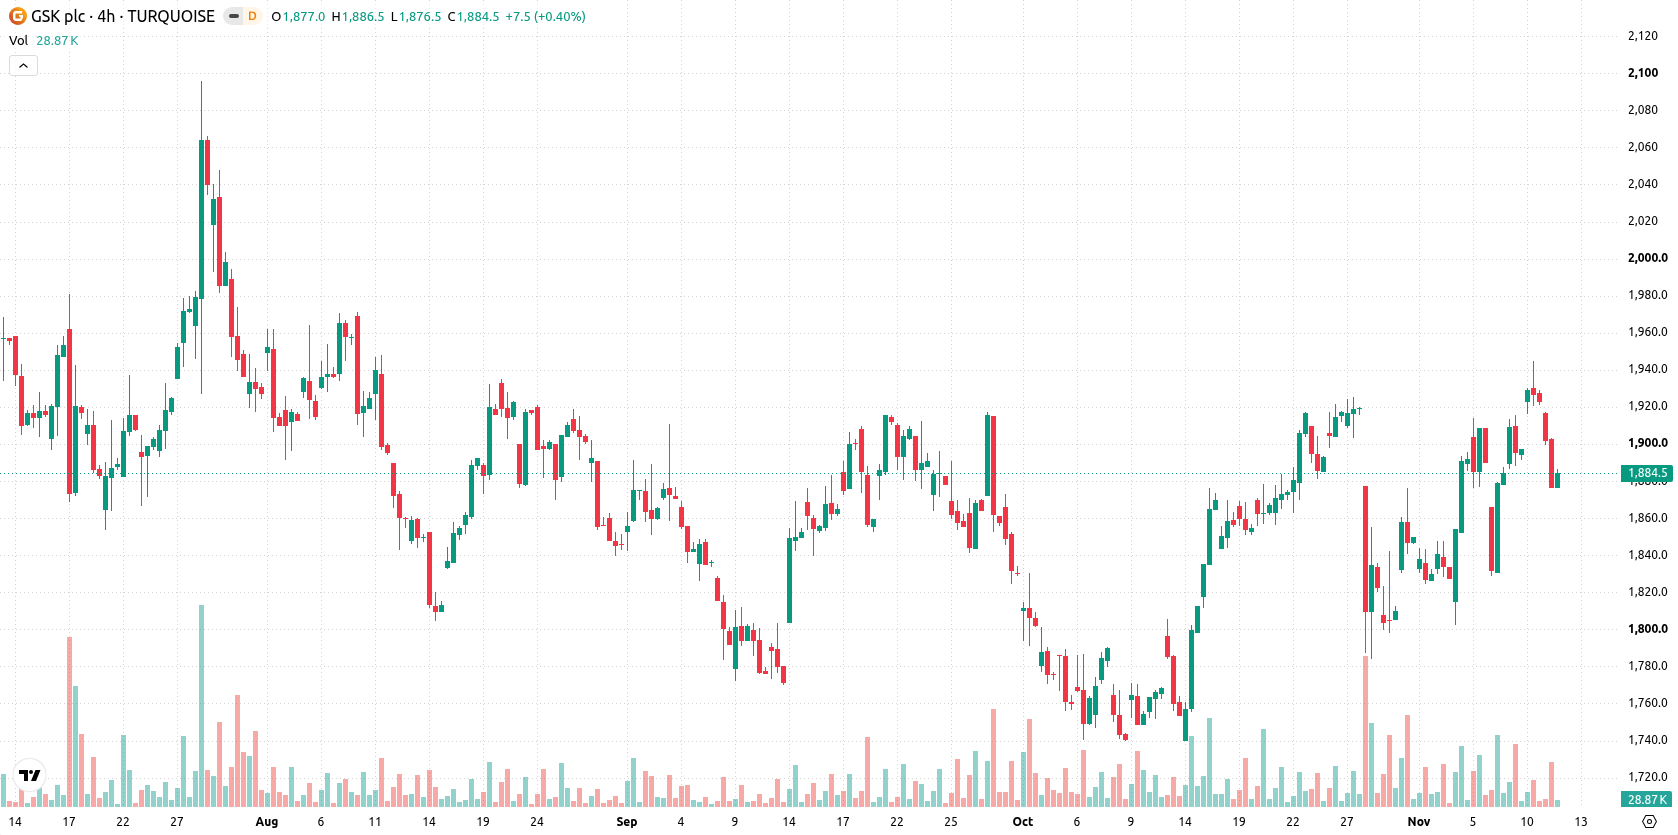
Mixed momentum signals limit upside despite break above short-term averages
GSK is trading above its 20-day and 50-day moving averages, at GBX1,874 and GBX1,844 respectively, indicating short- and medium-term upward pressure. However, the price remains below the 200-day moving average at GBX1,954, reflecting persistent longer-term resistance, with a near-term floor and ceiling set at GBX1,876 and GBX1,918. Momentum indicators are mixed: the MACD shows a bullish bias, but the Average Directional Index (ADX) signals weak trend strength. RSI, Stochastic RSI, and CCI readings are all neutral. Bull/Bear Power is positive, signaling buyers dominate intraday trading, and the Awesome Oscillator also points to prevailing upside, but oscillators and the HMA provide conflicting signals.
Earlier, analysts noted that GSK was consolidating with increased volatility and that price action near the 200-day moving average would be pivotal for further trend development. With current technicals showing continued upside momentum but unresolved long-term resistance, traders should monitor for a decisive breakout above the 200-day average as a potential inflection point for trend direction.









-
 Afghanistan
-
 Albania
-
 Algeria
-
 Angola
-
 Argentina
-
 Armenia
-
 Australia
-
 Austria
-
 Azerbaijan
-
 Bahamas
-
 Bahrain
-
 Bangladesh
-
 Belarus
-
 Belgium
-
 Bolivia
-
 Botswana
-
 Brazil
-
 Brunei
-
 Bulgaria
-
 Cambodia
-
 Cameroon
-
 Canada
-
 Chile
-
 China
-
 Colombia
-
 Congo
-
 Costa Rica
-
 Cote d'Ivoire
-
 Croatia
-
 Cuba
-
 Cyprus
-
 Czechia
-
 DR Congo
-
 Denmark
-
 Dominican Republic
-
 Ecuador
-
 Egypt
-
 El Salvador
-
 Estonia
-
 Eswatini
-
 Ethiopia
-
 Finland
-
 France
-
 Georgia
-
 Germany
-
 Ghana
-
 Greece
-
 Haiti
-
 Hong Kong
-
 Hungary
-
 India
-
 Indonesia
-
 Iran, Islamic republic
-
 Iraq
-
 Ireland
-
 Israel
-
 Italy
-
 Jamaica
-
 Japan
-
 Jordan
-
 Kazakhstan
-
 Kenya
-
 Korea
-
 Kuwait
-
 Kyrgyzstan
-
 Laos
-
 Latvia
-
 Lebanon
-
 Lesotho
-
 Libya
-
 Lithuania
-
 Luxembourg
-
 Madagascar
-
 Malaysia
-
 Malta
-
 Mauritius
-
 Mexico
-
 Moldova
-
 Mongolia
-
 Montenegro
-
 Morocco
-
 Mozambique
-
 Myanmar
-
 Namibia
-
 Nepal
-
 Netherlands
-
 New Zealand
-
 Nigeria
-
 North Macedonia
-
 Norway
-
 Oman
-
 Pakistan
-
 Palestine
-
 Panama
-
 Papua New Guinea
-
 Paraguay
-
 Peru
-
 Philippines
-
 Poland
-
 Portugal
-
 Puerto Rico
-
 Qatar
-
 Reunion
-
 Romania
-
 Rwanda
-
 Saudi Arabia
-
 Serbia
-
 Singapore
-
 Slovakia
-
 Slovenia
-
 Somalia
-
 South Africa
-
 Spain
-
 Sri Lanka
-
 Sweden
-
 Switzerland
-
 Syria
-
 Taiwan
-
 Tajikistan
-
 Tanzania
-
 Thailand
-
 Trinidad and Tobago
-
 Tunisia
-
 Turkey
-
 UAE
-
 Uganda
-
 Ukraine
-
 United Kingdom
-
United States
-
 Uruguay
-
 Uzbekistan
-
 Venezuela
-
 Vietnam
-
 Yemen
-
 Zambia
-
 Zimbabwe
- Forex
- Crypto












