

GSK plc executive share purchases: Can GSK sustain its recent gains?

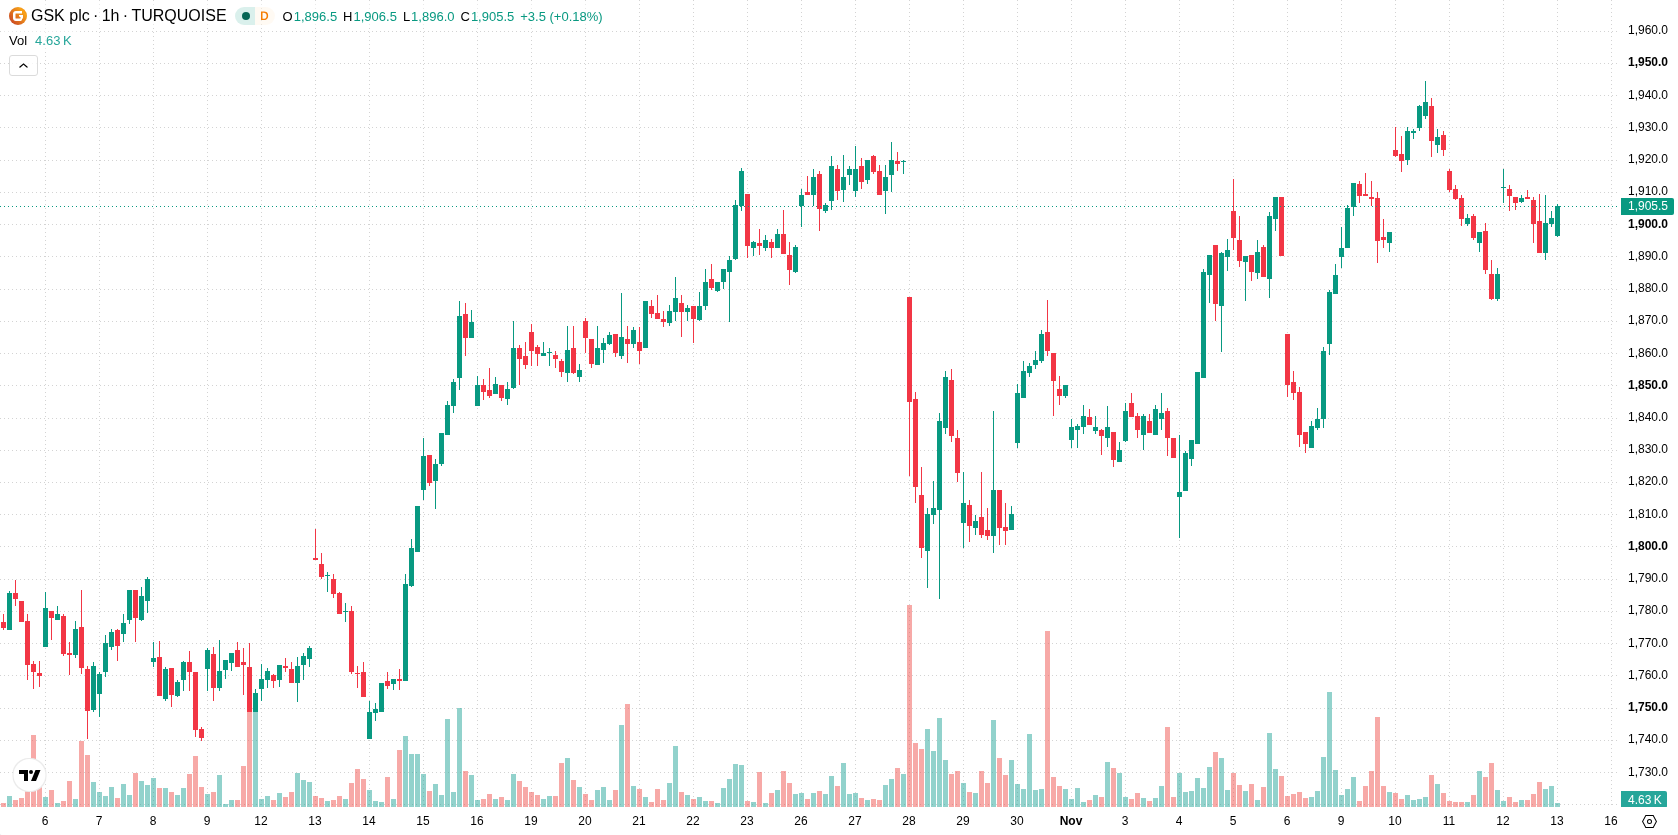
GSK (GSK) stock is trading at GBX1,908.50 after a modest move higher in the latest session. Price is currently situated above its key moving averages on short- and medium-term timeframes, reflecting a slight upward tilt.
 1949.50
1944.00
Highlights
- Five senior GSK executives acquired 12 ordinary shares each at £19.3453 on November 10, 2026, under the Share Reward Plan.
- The insider acquisition is modest in size but reflects management and shareholder interest alignment at a time of flat market performance.
- GSK stock closed at GBX1,908, up 0.39%, with price expected to oscillate between GBX1,877 and GBX1,939 and momentum indicators neutral.
Insider share purchases signal management confidence amid muted demand
GSK’s latest corporate disclosure showed that five senior executives, including Lynn Baxter, Julie Brown, David Redfern, Regis Simard, and James Strenner, acquired 12 ordinary shares each under the company's Share Reward Plan on November 10, 2026, at a transaction price of £19.3453 per share, according to Tipranks. Insider purchases of this nature typically indicate a steady alignment of management and shareholder interests, serving as a subtle signal of ongoing internal confidence in the company’s long-term outlook. While the transaction is modest in size, such activity can offer incremental support to share demand within the current flat market context.
Short-term strength contrasted by long-term resistance and neutral signals
On the technical front, GSK is trading above its MA-20 and MA-50 on the hourly chart, whereas the price remains below the MA-200 on the daily chart, revealing a divergence between short- and long-term momentum. The Ichimoku Kijun at GBX1,910 marks immediate resistance. Momentum signals remain neutral based on MACD and ADX, with RSI, Stoch RSI, and CCI all situated in their respective neutral zones. Intraday action is highlighted by a mild dominance of buyers as signaled by Bull/Bear Power, contrasted by a sell tone from the Awesome Oscillator, suggesting a balance between modest buying interest and more neutral to soft momentum.
Range-bound outlook persists unless resistance or support is breached
Looking ahead over the next 2–3 trading days, GSK is likely to trade within a typical volatility band from GBX1,877 to GBX1,939. The baseline scenario calls for range-bound movement within this corridor. Should price establish a sustained move above resistance at GBX1,910, an upside breakout scenario could become more probable. Conversely, a break below the lower bound would indicate a shift toward short-term weakness.
Earlier, analysts noted that GSK’s restructuring initiatives and recent technical setup positioned the stock for potential directional movement, contingent on overcoming persistent resistance levels. The latest indications of insider share purchases and mixed momentum signals add a layer of management alignment and technical complexity, with immediate resistance at GBX1,910 serving as the key pivot to monitor for a potential breakout.









-
 Afghanistan
-
 Albania
-
 Algeria
-
 Angola
-
 Argentina
-
 Armenia
-
 Australia
-
 Austria
-
 Azerbaijan
-
 Bahamas
-
 Bahrain
-
 Bangladesh
-
 Belarus
-
 Belgium
-
 Bolivia
-
 Botswana
-
 Brazil
-
 Brunei
-
 Bulgaria
-
 Cambodia
-
 Cameroon
-
 Canada
-
 Chile
-
 China
-
 Colombia
-
 Congo
-
 Costa Rica
-
 Cote d'Ivoire
-
 Croatia
-
 Cuba
-
 Cyprus
-
 Czechia
-
 DR Congo
-
 Denmark
-
 Dominican Republic
-
 Ecuador
-
 Egypt
-
 El Salvador
-
 Estonia
-
 Eswatini
-
 Ethiopia
-
 Finland
-
 France
-
 Georgia
-
 Germany
-
 Ghana
-
 Greece
-
 Haiti
-
 Hong Kong
-
 Hungary
-
 India
-
 Indonesia
-
 Iran, Islamic republic
-
 Iraq
-
 Ireland
-
 Israel
-
 Italy
-
 Jamaica
-
 Japan
-
 Jordan
-
 Kazakhstan
-
 Kenya
-
 Korea
-
 Kuwait
-
 Kyrgyzstan
-
 Laos
-
 Latvia
-
 Lebanon
-
 Lesotho
-
 Libya
-
 Lithuania
-
 Luxembourg
-
 Madagascar
-
 Malaysia
-
 Malta
-
 Mauritius
-
 Mexico
-
 Moldova
-
 Mongolia
-
 Montenegro
-
 Morocco
-
 Mozambique
-
 Myanmar
-
 Namibia
-
 Nepal
-
 Netherlands
-
 New Zealand
-
 Nigeria
-
 North Macedonia
-
 Norway
-
 Oman
-
 Pakistan
-
 Palestine
-
 Panama
-
 Papua New Guinea
-
 Paraguay
-
 Peru
-
 Philippines
-
 Poland
-
 Portugal
-
 Puerto Rico
-
 Qatar
-
 Reunion
-
 Romania
-
 Rwanda
-
 Saudi Arabia
-
 Serbia
-
 Singapore
-
 Slovakia
-
 Slovenia
-
 Somalia
-
 South Africa
-
 Spain
-
 Sri Lanka
-
 Sweden
-
 Switzerland
-
 Syria
-
 Taiwan
-
 Tajikistan
-
 Tanzania
-
 Thailand
-
 Trinidad and Tobago
-
 Tunisia
-
 Turkey
-
 UAE
-
 Uganda
-
 Ukraine
-
 United Kingdom
-
United States
-
 Uruguay
-
 Uzbekistan
-
 Venezuela
-
 Vietnam
-
 Yemen
-
 Zambia
-
 Zimbabwe
- Forex
- Crypto












