

NNDM heads lower as recent weakness intensifies amid selling pressure

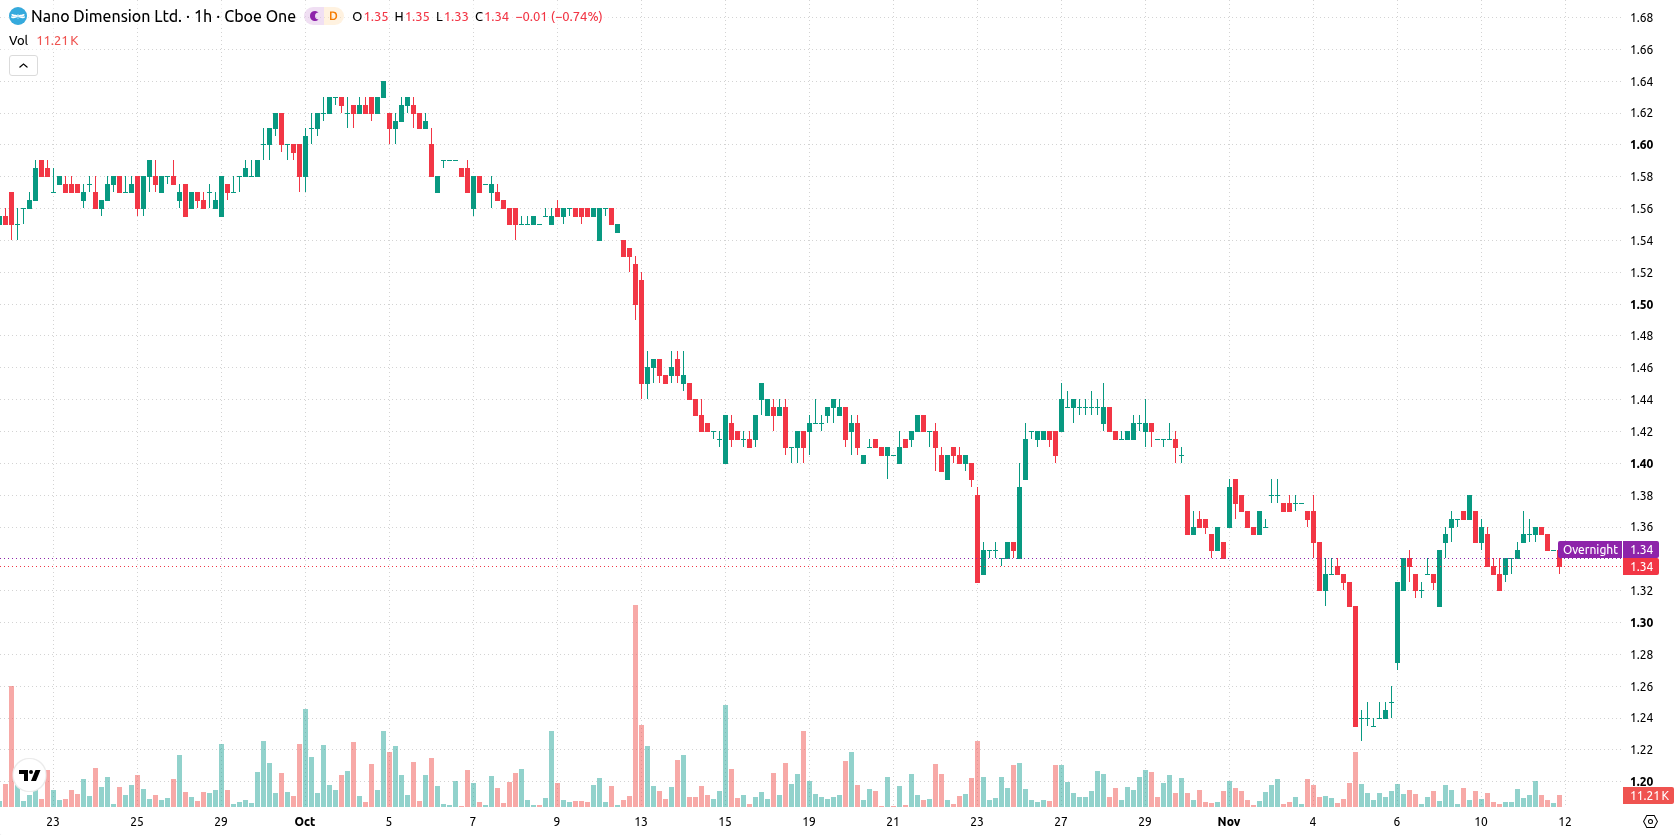
Nano Dimension (NNDM) stock is trading at $1.33, down 1.48% on the day and moving near the session low. The price continues to trend below its key moving averages and remains in a high-volatility environment.
 1.28
1.38
Highlights
- NNDM/USD trades below key moving averages, indicating persistent bearish pressure in both short- and long-term timeframes.
- Oscillators such as Stoch RSI and CCI are in oversold zones, suggesting possible short-term selling exhaustion despite overall neutral momentum.
- Expected price range for the next 2 to 3 trading days is $1.26 to $1.40, with probability favoring a downside move at 77%.
Mixed short-term signals as momentum builds under resistance
On the hourly chart, NNDM is trading below its MA-20 and directly at the MA-50, while still positioned under the long-term MA-200. The Ichimoku Kijun sits at $1.35, creating immediate resistance. The MACD indicates strong buy momentum, yet ADX remains neutral. While RSI is neutral, both Stochastic RSI and CCI have entered oversold territory, suggesting increasing short-term selling exhaustion. Bull/Bear Power is neutral at 0, and the Awesome Oscillator also reads as neutral. This combination reflects a market with unclear trend strength, heightened volatility, and mixed momentum signals.
Elevated downside risk as price holds within volatile range
In the next two to three trading days, NNDM is expected to fluctuate between $1.26 and $1.40. The probability of a downside move is elevated at 77%, while the chance of an advance stands at 23%. The baseline scenario sees price action contained within this volatility band. In a bullish case, a move above the $1.35 resistance could drive further gains. Conversely, a break below support at $1.26 would open the door for additional downside.
Earlier, analysts noted that Nano Dimension was exhibiting mixed technical signals amid a volatile, rangebound environment. The current analysis reaffirms this indecisive market dynamic, highlighting the importance of monitoring the $1.35 resistance level for signs of a potential directional breakout.






Latest Nano Dimension News




-
 Afghanistan
-
 Albania
-
 Algeria
-
 Angola
-
 Argentina
-
 Armenia
-
 Australia
-
 Austria
-
 Azerbaijan
-
 Bahamas
-
 Bahrain
-
 Bangladesh
-
 Belarus
-
 Belgium
-
 Bolivia
-
 Botswana
-
 Brazil
-
 Brunei
-
 Bulgaria
-
 Cambodia
-
 Cameroon
-
 Canada
-
 Chile
-
 China
-
 Colombia
-
 Congo
-
 Costa Rica
-
 Cote d'Ivoire
-
 Croatia
-
 Cuba
-
 Cyprus
-
 Czechia
-
 DR Congo
-
 Denmark
-
 Dominican Republic
-
 Ecuador
-
 Egypt
-
 El Salvador
-
 Estonia
-
 Eswatini
-
 Ethiopia
-
 Finland
-
 France
-
 Georgia
-
 Germany
-
 Ghana
-
 Greece
-
 Haiti
-
 Hong Kong
-
 Hungary
-
 India
-
 Indonesia
-
 Iran, Islamic republic
-
 Iraq
-
 Ireland
-
 Israel
-
 Italy
-
 Jamaica
-
 Japan
-
 Jordan
-
 Kazakhstan
-
 Kenya
-
 Korea
-
 Kuwait
-
 Kyrgyzstan
-
 Laos
-
 Latvia
-
 Lebanon
-
 Lesotho
-
 Libya
-
 Lithuania
-
 Luxembourg
-
 Madagascar
-
 Malaysia
-
 Malta
-
 Mauritius
-
 Mexico
-
 Moldova
-
 Mongolia
-
 Montenegro
-
 Morocco
-
 Mozambique
-
 Myanmar
-
 Namibia
-
 Nepal
-
 Netherlands
-
 New Zealand
-
 Nigeria
-
 North Macedonia
-
 Norway
-
 Oman
-
 Pakistan
-
 Palestine
-
 Panama
-
 Papua New Guinea
-
 Paraguay
-
 Peru
-
 Philippines
-
 Poland
-
 Portugal
-
 Puerto Rico
-
 Qatar
-
 Reunion
-
 Romania
-
 Rwanda
-
 Saudi Arabia
-
 Serbia
-
 Singapore
-
 Slovakia
-
 Slovenia
-
 Somalia
-
 South Africa
-
 Spain
-
 Sri Lanka
-
 Sweden
-
 Switzerland
-
 Syria
-
 Taiwan
-
 Tajikistan
-
 Tanzania
-
 Thailand
-
 Trinidad and Tobago
-
 Tunisia
-
 Turkey
-
 UAE
-
 Uganda
-
 Ukraine
-
 United Kingdom
-
United States
-
 Uruguay
-
 Uzbekistan
-
 Venezuela
-
 Vietnam
-
 Yemen
-
 Zambia
-
 Zimbabwe
- Forex
- Crypto












