

What's behind Nano Dimension's latest 3.4% stock pullback?

Nano Dimension Ltd (NNDM) fell 3.38% amid ongoing downside momentum and sustained selling pressure. The move is supported by the stock trading below its 20-day, 50-day, and 200-day moving averages.
 1.28
1.38
Highlights
- Nano Dimension stock trades below major moving averages, indicating seller control in short, medium, and long term.
- Bearish momentum prevails with MACD and ADX issuing sell signals, while other indicators remain neutral and not overbought or oversold.
- Shares are projected to trade between $1.24 and $1.34 over the next five sessions, with a 79% chance of further downside.
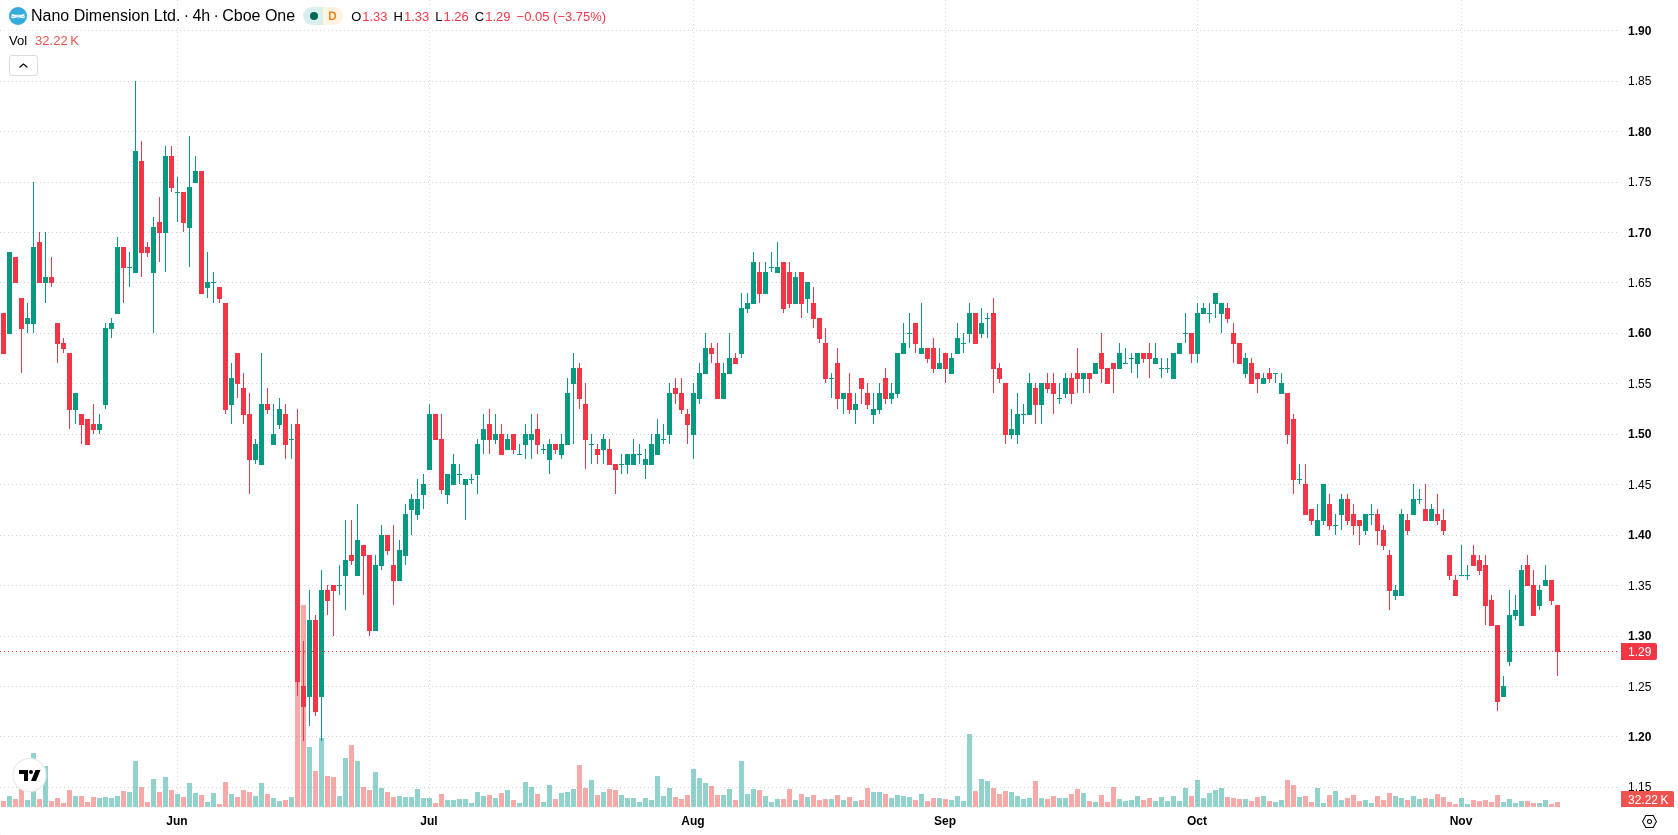
Bearish signals persist as price stalls below key technical thresholds
Nano Dimension is trading below its 20-day, 50-day, and 200-day moving averages ($1.37, $1.48, and $1.62 respectively), which points to ongoing short-, medium-, and long-term seller pressure. The nearest resistance is at $1.34, while immediate support lies at $1.28. Momentum indicators reveal bearish undertones: MACD and Average Directional Index (ADX) both issue sell signals, suggesting downside momentum dominates. The Relative Strength Index (RSI), Stochastic RSI, and Commodity Channel Index (CCI) are all neutral and outside of overbought or oversold territory. Bull/Bear Power (BBP) is positive, signaling buyers have a slight advantage on the day. The price is currently at $1.29, down 3.38% after a downside gap of about 0.75%, trading near the day’s low with intraday volatility at 4.69%. This reflects sustained pressure after the open, broadly in line with bearish momentum signals.
Earlier, analysts noted that Nano Dimension was exhibiting mixed technical signals amid a volatile, rangebound environment. The latest data reinforce a bearish bias, with the downside risk heightened as sustained pressure places critical focus on the $1.28 support as the key level to watch over the coming sessions.






Latest Nano Dimension News




-
 Afghanistan
-
 Albania
-
 Algeria
-
 Angola
-
 Argentina
-
 Armenia
-
 Australia
-
 Austria
-
 Azerbaijan
-
 Bahamas
-
 Bahrain
-
 Bangladesh
-
 Belarus
-
 Belgium
-
 Bolivia
-
 Botswana
-
 Brazil
-
 Brunei
-
 Bulgaria
-
 Cambodia
-
 Cameroon
-
 Canada
-
 Chile
-
 China
-
 Colombia
-
 Congo
-
 Costa Rica
-
 Cote d'Ivoire
-
 Croatia
-
 Cuba
-
 Cyprus
-
 Czechia
-
 DR Congo
-
 Denmark
-
 Dominican Republic
-
 Ecuador
-
 Egypt
-
 El Salvador
-
 Estonia
-
 Eswatini
-
 Ethiopia
-
 Finland
-
 France
-
 Georgia
-
 Germany
-
 Ghana
-
 Greece
-
 Haiti
-
 Hong Kong
-
 Hungary
-
 India
-
 Indonesia
-
 Iran, Islamic republic
-
 Iraq
-
 Ireland
-
 Israel
-
 Italy
-
 Jamaica
-
 Japan
-
 Jordan
-
 Kazakhstan
-
 Kenya
-
 Korea
-
 Kuwait
-
 Kyrgyzstan
-
 Laos
-
 Latvia
-
 Lebanon
-
 Lesotho
-
 Libya
-
 Lithuania
-
 Luxembourg
-
 Madagascar
-
 Malaysia
-
 Malta
-
 Mauritius
-
 Mexico
-
 Moldova
-
 Mongolia
-
 Montenegro
-
 Morocco
-
 Mozambique
-
 Myanmar
-
 Namibia
-
 Nepal
-
 Netherlands
-
 New Zealand
-
 Nigeria
-
 North Macedonia
-
 Norway
-
 Oman
-
 Pakistan
-
 Palestine
-
 Panama
-
 Papua New Guinea
-
 Paraguay
-
 Peru
-
 Philippines
-
 Poland
-
 Portugal
-
 Puerto Rico
-
 Qatar
-
 Reunion
-
 Romania
-
 Rwanda
-
 Saudi Arabia
-
 Serbia
-
 Singapore
-
 Slovakia
-
 Slovenia
-
 Somalia
-
 South Africa
-
 Spain
-
 Sri Lanka
-
 Sweden
-
 Switzerland
-
 Syria
-
 Taiwan
-
 Tajikistan
-
 Tanzania
-
 Thailand
-
 Trinidad and Tobago
-
 Tunisia
-
 Turkey
-
 UAE
-
 Uganda
-
 Ukraine
-
 United Kingdom
-
United States
-
 Uruguay
-
 Uzbekistan
-
 Venezuela
-
 Vietnam
-
 Yemen
-
 Zambia
-
 Zimbabwe
- Forex
- Crypto












