

Hims & Hers Health reports strong revenue, new treatments: Can HIMS sustain recent gains?

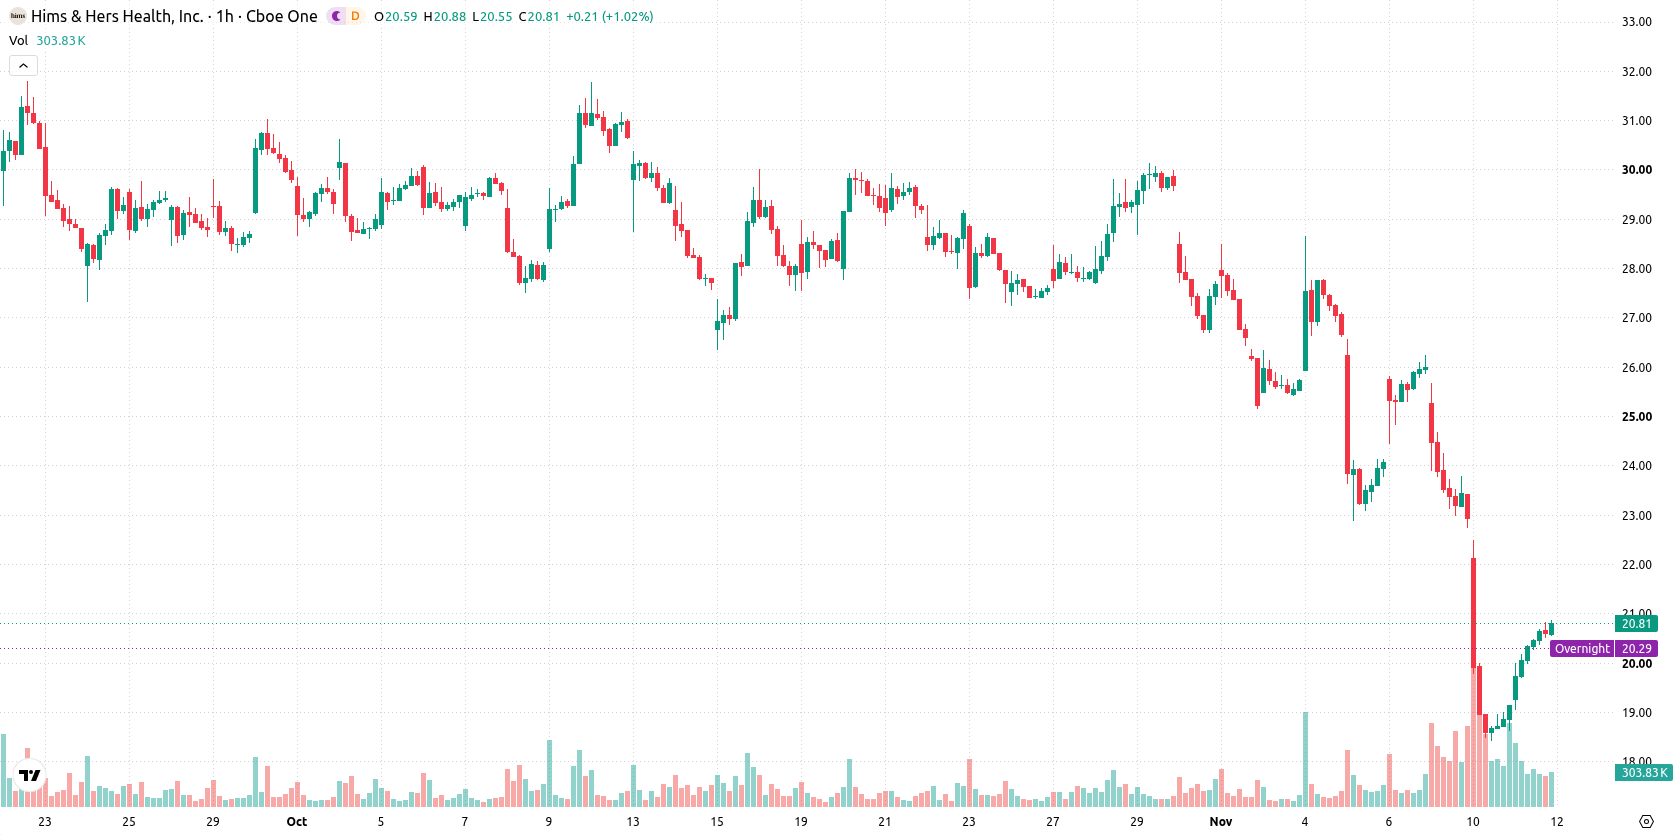
Hims & Hers Health (HIMS) stock is trading at $20.81 after surging 8.73% on the day. The price finished near the top of the daily range and currently sits above its short-term averages, while remaining below long-term trend gauges.
 20.16
25.62
Highlights
- Hims & Hers Health reported third-quarter 2026 revenue of $890.4 million, up 49% year over year, with gross margin falling to 57% and a net loss of $33 million.
- Recent actions include the appointment of Andrew Huberman, Ph.D., to the board, a planned peptide-based treatment launch, and unresolved litigation involving seven states and the FTC.
- Shares jumped 8.73% to $20.81 with high volatility, but technical signals indicate short-term support and a greater probability of a move down toward $17.23 in the next few days.
Subscriber growth offsets margin squeeze as legal and policy shifts weigh
Hims & Hers Health reported third-quarter 2026 revenue of $890.4 million, a 49% year-over-year increase that demonstrates impressive subscriber growth, though the results fell short of consensus expectations as gross margin declined to 57% and the company posted a net loss of $33 million, according to Pulse2. This mix of top-line strength and margin contraction sets a complex backdrop for price action, balancing robust demand with earnings risk. Secondary developments include the appointment of Andrew Huberman, Ph.D., to the board, likely enhancing the company’s scientific and marketing profile as reported by Benzinga, and an announced launch of peptide-based treatments following a federal policy change, according to Americanmedspa. However, ongoing litigation from seven states and the FTC over alleged data-sharing practices introduces legal uncertainty, as reported by Mlex.
Technical resistance and strong sell signals limit upside momentum
On the technical front, HIMS is trading above the MA-20 but remains below the MA-50 and MA-200 on the hourly chart. The Ichimoku Kijun at $22.32 serves as immediate resistance, while the forecasted support is located near $17.23. MACD and ADX both indicate strong sell momentum, whereas RSI and CCI remain neutral. Stochastic RSI is overbought, flagging a potential short-term correction, while Bull/Bear Power is modestly positive and the Awesome Oscillator shows no directional bias.
Downside risk dominates as volatility band narrows near key levels
Over the next 2–3 days, HIMS is expected to trade within a volatility band between $17.23 and $24.39. The probability of a downside move is higher at 60%, while the up-move probability is 40%. A decisive break above $22.32 could open a path toward higher targets, while movement below $17.23 would suggest further selling and risk of an extended decline.
Previously it was reported that Hims & Hers Health faced persistent downside pressure as bearish technical signals and ongoing regulatory risks weighed on the outlook. With the stock now exhibiting divergent short- and long-term signals amid elevated legal uncertainty, traders should closely monitor price action around the $22.32 resistance level for indications of any sustained directional move.






Latest Hims & Hers News




-
 Afghanistan
-
 Albania
-
 Algeria
-
 Angola
-
 Argentina
-
 Armenia
-
 Australia
-
 Austria
-
 Azerbaijan
-
 Bahamas
-
 Bahrain
-
 Bangladesh
-
 Belarus
-
 Belgium
-
 Bolivia
-
 Botswana
-
 Brazil
-
 Brunei
-
 Bulgaria
-
 Cambodia
-
 Cameroon
-
 Canada
-
 Chile
-
 China
-
 Colombia
-
 Congo
-
 Costa Rica
-
 Cote d'Ivoire
-
 Croatia
-
 Cuba
-
 Cyprus
-
 Czechia
-
 DR Congo
-
 Denmark
-
 Dominican Republic
-
 Ecuador
-
 Egypt
-
 El Salvador
-
 Estonia
-
 Eswatini
-
 Ethiopia
-
 Finland
-
 France
-
 Georgia
-
 Germany
-
 Ghana
-
 Greece
-
 Haiti
-
 Hong Kong
-
 Hungary
-
 India
-
 Indonesia
-
 Iran, Islamic republic
-
 Iraq
-
 Ireland
-
 Israel
-
 Italy
-
 Jamaica
-
 Japan
-
 Jordan
-
 Kazakhstan
-
 Kenya
-
 Korea
-
 Kuwait
-
 Kyrgyzstan
-
 Laos
-
 Latvia
-
 Lebanon
-
 Lesotho
-
 Libya
-
 Lithuania
-
 Luxembourg
-
 Madagascar
-
 Malaysia
-
 Malta
-
 Mauritius
-
 Mexico
-
 Moldova
-
 Mongolia
-
 Montenegro
-
 Morocco
-
 Mozambique
-
 Myanmar
-
 Namibia
-
 Nepal
-
 Netherlands
-
 New Zealand
-
 Nigeria
-
 North Macedonia
-
 Norway
-
 Oman
-
 Pakistan
-
 Palestine
-
 Panama
-
 Papua New Guinea
-
 Paraguay
-
 Peru
-
 Philippines
-
 Poland
-
 Portugal
-
 Puerto Rico
-
 Qatar
-
 Reunion
-
 Romania
-
 Rwanda
-
 Saudi Arabia
-
 Serbia
-
 Singapore
-
 Slovakia
-
 Slovenia
-
 Somalia
-
 South Africa
-
 Spain
-
 Sri Lanka
-
 Sweden
-
 Switzerland
-
 Syria
-
 Taiwan
-
 Tajikistan
-
 Tanzania
-
 Thailand
-
 Trinidad and Tobago
-
 Tunisia
-
 Turkey
-
 UAE
-
 Uganda
-
 Ukraine
-
 United Kingdom
-
United States
-
 Uruguay
-
 Uzbekistan
-
 Venezuela
-
 Vietnam
-
 Yemen
-
 Zambia
-
 Zimbabwe
- Forex
- Crypto












