

Can margin pressures and insider selling trigger further losses for HIMS?

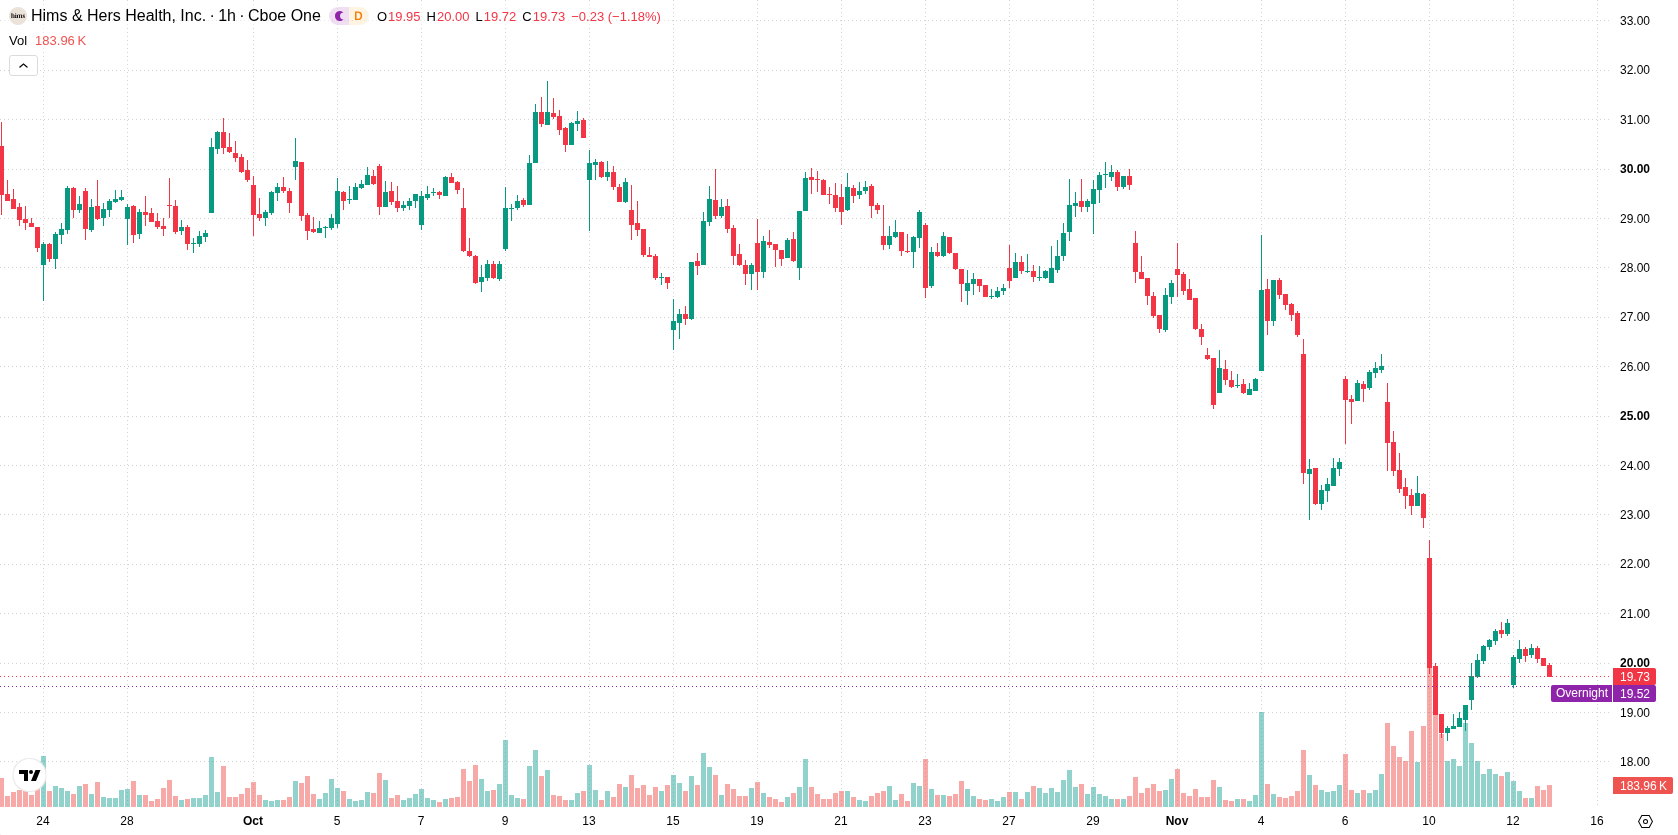
Hims & Hers Health (HIMS) stock is trading at $19.73 after a daily decline of 5.19%. The price sits below all its key moving averages, reflecting persistent weakness across short-, medium-, and long-term periods.
 20.14
25.62
Highlights
- Hims & Hers Health reported third-quarter 2026 revenue of $890 million, up 49% year over year but below analyst forecasts.
- The company posted adjusted EBITDA of $82 million, a net loss of $33 million, and saw gross margin decline to 57%.
- Shares closed at $19.73 after a 5.19% drop with bearish technical signals and a projected range of $16.24 to $23.22 for the next few sessions.
Earnings and margin pressures amid missed estimates and insider sales
Hims & Hers Health reported third-quarter 2026 revenue of $890 million, representing 49% year-over-year growth but falling short of analyst expectations. The company posted adjusted EBITDA of $82 million and a net loss of $33 million, with gross margin slipping to 57%, highlighting earnings and margin pressures. Management strategically reduced marketing investments, which led to subscriber headwinds and constrained near-term growth prospects. Additionally, a Form 144 filing disclosed the potential intent for insider securities sales, according to Investing.com, further adding to investor caution.
Bearish momentum confirmed as price and indicators remain under pressure
Technically, HIMS is trading below its MA-20, MA-50, and MA-200, underscoring sustained downside across all examined timeframes. The Ichimoku Kijun sits at $21.33, marking the nearest resistance level. Momentum indicators show persistent bearishness: the MACD gives a Strong Sell reading while the ADX also signals a Sell. Bull/Bear Power is negative at -0.23. Meanwhile, oscillators such as RSI, Stoch RSI, and CCI remain in neutral zones, suggesting there is not yet an extreme in either direction. The session closed with a negative gap of 1.28 and high volatility, as price finished near its intraday low.
Sideways consolidation likely as upside scenario faces low odds
Looking ahead to the next 2–3 trading days, HIMS is expected to fluctuate within the $16.24 to $23.22 range, reflecting a typical volatility band relative to current levels. A break above the $21.33 resistance would be required to signal a potential bullish scenario, but this outcome carries a very low probability under current conditions. The baseline view is for the price to consolidate sideways within the given corridor, while a bearish scenario could emerge if support at $16.24 is breached.
Earlier, analysts noted that Hims & Hers Health faced ongoing downside risk as margin pressures, weaker-than-expected earnings, and bearish technical trends persisted. The current analysis strengthens that cautious outlook by highlighting continued technical weakness and volatility, making a sustained move above resistance at $21.33 a key hurdle to monitor for any shift in trend.











-
 Afghanistan
-
 Albania
-
 Algeria
-
 Angola
-
 Argentina
-
 Armenia
-
 Australia
-
 Austria
-
 Azerbaijan
-
 Bahamas
-
 Bahrain
-
 Bangladesh
-
 Belarus
-
 Belgium
-
 Bolivia
-
 Botswana
-
 Brazil
-
 Brunei
-
 Bulgaria
-
 Cambodia
-
 Cameroon
-
 Canada
-
 Chile
-
 China
-
 Colombia
-
 Congo
-
 Costa Rica
-
 Cote d'Ivoire
-
 Croatia
-
 Cuba
-
 Cyprus
-
 Czechia
-
 DR Congo
-
 Denmark
-
 Dominican Republic
-
 Ecuador
-
 Egypt
-
 El Salvador
-
 Estonia
-
 Eswatini
-
 Ethiopia
-
 Finland
-
 France
-
 Georgia
-
 Germany
-
 Ghana
-
 Greece
-
 Haiti
-
 Hong Kong
-
 Hungary
-
 India
-
 Indonesia
-
 Iran, Islamic republic
-
 Iraq
-
 Ireland
-
 Israel
-
 Italy
-
 Jamaica
-
 Japan
-
 Jordan
-
 Kazakhstan
-
 Kenya
-
 Korea
-
 Kuwait
-
 Kyrgyzstan
-
 Laos
-
 Latvia
-
 Lebanon
-
 Lesotho
-
 Libya
-
 Lithuania
-
 Luxembourg
-
 Madagascar
-
 Malaysia
-
 Malta
-
 Mauritius
-
 Mexico
-
 Moldova
-
 Mongolia
-
 Montenegro
-
 Morocco
-
 Mozambique
-
 Myanmar
-
 Namibia
-
 Nepal
-
 Netherlands
-
 New Zealand
-
 Nigeria
-
 North Macedonia
-
 Norway
-
 Oman
-
 Pakistan
-
 Palestine
-
 Panama
-
 Papua New Guinea
-
 Paraguay
-
 Peru
-
 Philippines
-
 Poland
-
 Portugal
-
 Puerto Rico
-
 Qatar
-
 Reunion
-
 Romania
-
 Rwanda
-
 Saudi Arabia
-
 Serbia
-
 Singapore
-
 Slovakia
-
 Slovenia
-
 Somalia
-
 South Africa
-
 Spain
-
 Sri Lanka
-
 Sweden
-
 Switzerland
-
 Syria
-
 Taiwan
-
 Tajikistan
-
 Tanzania
-
 Thailand
-
 Trinidad and Tobago
-
 Tunisia
-
 Turkey
-
 UAE
-
 Uganda
-
 Ukraine
-
 United Kingdom
-
United States
-
 Uruguay
-
 Uzbekistan
-
 Venezuela
-
 Vietnam
-
 Yemen
-
 Zambia
-
 Zimbabwe
- Forex
- Crypto












