

Tesco stock trades flat as mixed momentum signals limit direction

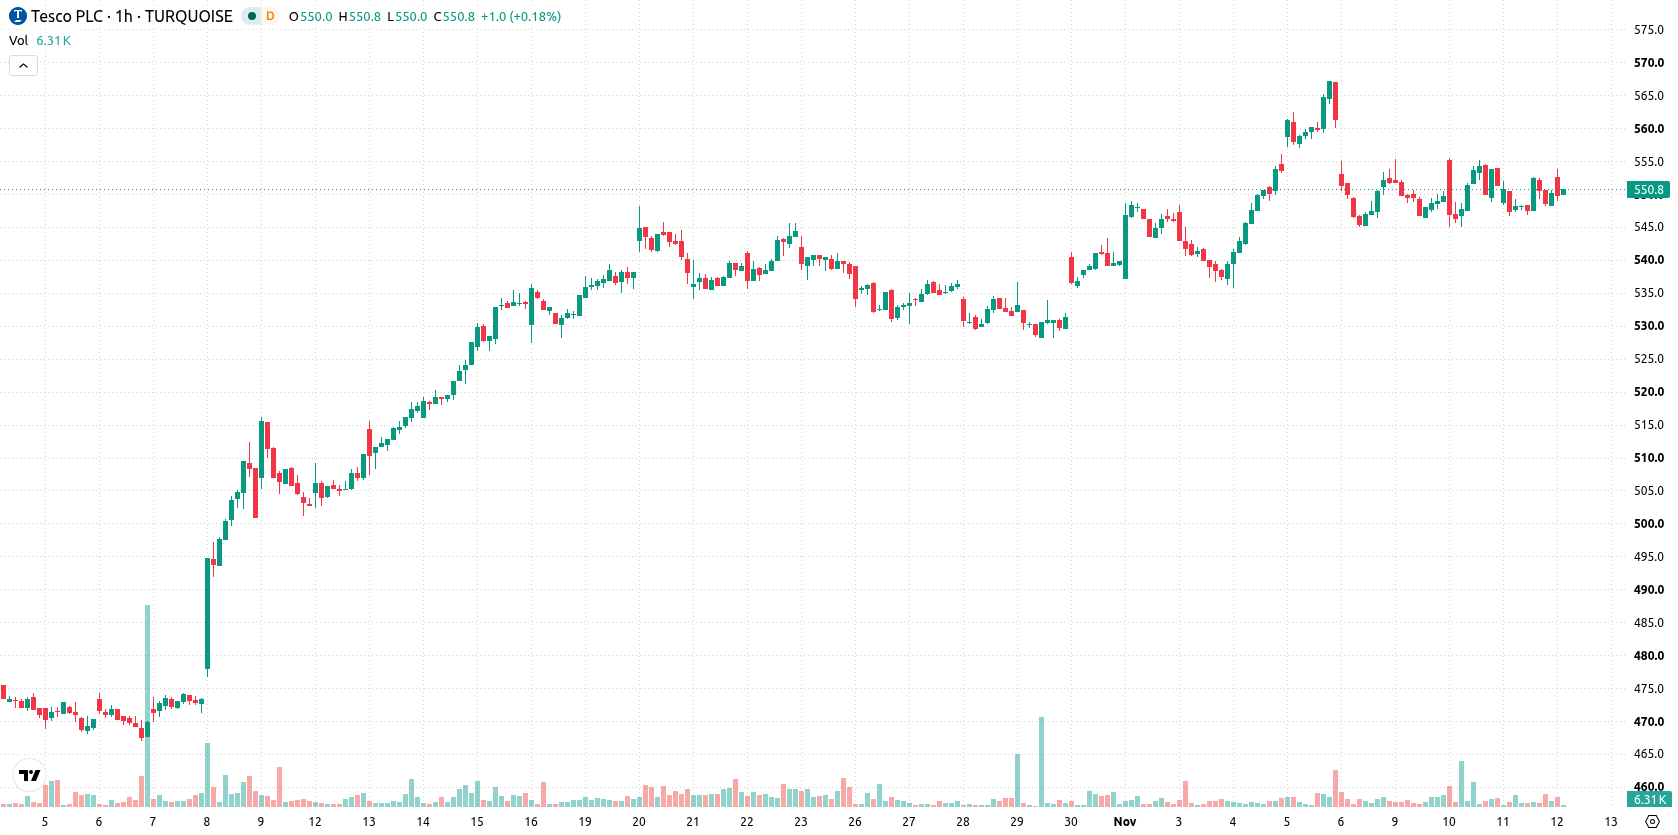
Tesco (TSCO) stock is trading at GBX550.8, showing a marginal daily gain within a session marked by low volatility. The price is above its key short-term moving average but remains below the intermediate moving average, while long-term momentum still signals underlying strength.
 561.00
Highlights
- TSCO/GBX trades above its long-term moving average but below its medium-term level, indicating sustained underlying strength with constrained momentum.
- Technical indicators are split, with a negative MACD balanced by positive Bull/Bear Power and Awesome Oscillator readings, while most oscillators remain neutral.
- TSCO/GBX is expected to fluctuate between GBX545.79 and GBX557 over the next several days, with a 53% probability of downside versus 47% upside.
Mixed momentum signals as support holds above key moving averages
Intraday, TSCO trades above its MA-20 but below the MA-50 on the hourly timeframe, while staying well above the MA-200 on the daily chart. Immediate technical support is noted at the Ichimoku Kijun level of GBX550.4, with the short-term price band bounded by support at GBX545.79 and resistance near GBX557. Momentum signals remain mixed, as MACD indicates a strong sell and ADX is neutral, while RSI, Stoch RSI, and CCI all sit in neutral territory. Notably, Bull/Bear Power shows a positive reading of 3.4, highlighting moderate buying activity intraday, and the Awesome Oscillator flashes a strong buy, adding a bullish undertone despite the session's indecisive character.
Range-bound outlook with downside risk outweighing limited upside
In the short term, TSCO is expected to oscillate within the narrow range of GBX545.79 to GBX557. Scenario probabilities are relatively balanced, with a 47% chance of an upward move and a slightly higher 53% probability for a downside break. Unless a decisive push is seen above resistance or below support, price action is likely to remain confined to this typical volatility band.
Earlier, analysts noted that Tesco exhibited mixed technical momentum and a tendency toward short-term consolidation. The current analysis builds on this outlook, highlighting that directional conviction remains elusive and placing emphasis on the need to monitor for a sustained break above resistance or below support as the next signal for a clear trend shift.











-
 Afghanistan
-
 Albania
-
 Algeria
-
 Angola
-
 Argentina
-
 Armenia
-
 Australia
-
 Austria
-
 Azerbaijan
-
 Bahamas
-
 Bahrain
-
 Bangladesh
-
 Belarus
-
 Belgium
-
 Bolivia
-
 Botswana
-
 Brazil
-
 Brunei
-
 Bulgaria
-
 Cambodia
-
 Cameroon
-
 Canada
-
 Chile
-
 China
-
 Colombia
-
 Congo
-
 Costa Rica
-
 Cote d'Ivoire
-
 Croatia
-
 Cuba
-
 Cyprus
-
 Czechia
-
 DR Congo
-
 Denmark
-
 Dominican Republic
-
 Ecuador
-
 Egypt
-
 El Salvador
-
 Estonia
-
 Eswatini
-
 Ethiopia
-
 Finland
-
 France
-
 Georgia
-
 Germany
-
 Ghana
-
 Greece
-
 Haiti
-
 Hong Kong
-
 Hungary
-
 India
-
 Indonesia
-
 Iran, Islamic republic
-
 Iraq
-
 Ireland
-
 Israel
-
 Italy
-
 Jamaica
-
 Japan
-
 Jordan
-
 Kazakhstan
-
 Kenya
-
 Korea
-
 Kuwait
-
 Kyrgyzstan
-
 Laos
-
 Latvia
-
 Lebanon
-
 Lesotho
-
 Libya
-
 Lithuania
-
 Luxembourg
-
 Madagascar
-
 Malaysia
-
 Malta
-
 Mauritius
-
 Mexico
-
 Moldova
-
 Mongolia
-
 Montenegro
-
 Morocco
-
 Mozambique
-
 Myanmar
-
 Namibia
-
 Nepal
-
 Netherlands
-
 New Zealand
-
 Nigeria
-
 North Macedonia
-
 Norway
-
 Oman
-
 Pakistan
-
 Palestine
-
 Panama
-
 Papua New Guinea
-
 Paraguay
-
 Peru
-
 Philippines
-
 Poland
-
 Portugal
-
 Puerto Rico
-
 Qatar
-
 Reunion
-
 Romania
-
 Rwanda
-
 Saudi Arabia
-
 Serbia
-
 Singapore
-
 Slovakia
-
 Slovenia
-
 Somalia
-
 South Africa
-
 Spain
-
 Sri Lanka
-
 Sweden
-
 Switzerland
-
 Syria
-
 Taiwan
-
 Tajikistan
-
 Tanzania
-
 Thailand
-
 Trinidad and Tobago
-
 Tunisia
-
 Turkey
-
 UAE
-
 Uganda
-
 Ukraine
-
 United Kingdom
-
United States
-
 Uruguay
-
 Uzbekistan
-
 Venezuela
-
 Vietnam
-
 Yemen
-
 Zambia
-
 Zimbabwe
- Forex
- Crypto












