

Tesco shares technical analysis: Mixed signals persist near GBX558.76 resistance zone

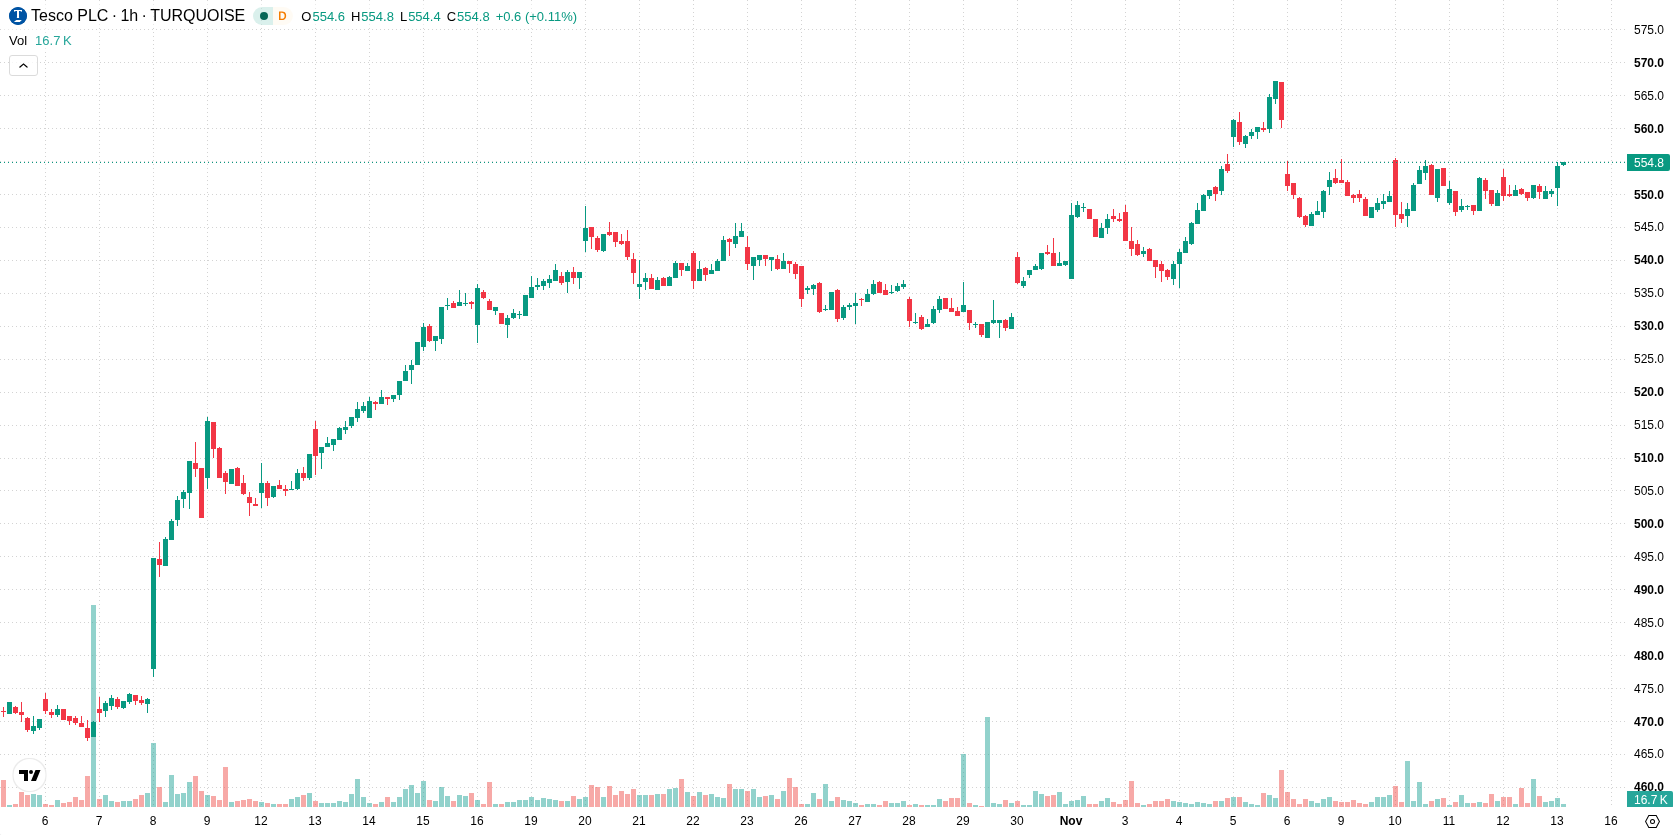
Tesco (TSCO) stock is trading at GBX554.2, ending the latest session with a modest gain and closing near the session's high. The price remains above its key moving averages on both short- and long-term timeframes.
 561.00
Highlights
- Tesco stock trades well above short, medium, and long term moving averages, confirming persistent bullish momentum.
- Multiple indicators show strong trend strength, but overbought readings on Stoch RSI and CCI indicate risk of a short-term pullback.
- Tesco stock is expected to consolidate in a GBX548.8 to GBX558.76 range, with further gains likely and low probability of decline.
Bullish momentum signals offset by overbought oscillators
The price is positioned above the MA-20 (GBX550.09) and MA-50 (GBX550.94) on the hourly chart, as well as the MA-200 (GBX478.33) on the daily timeframe. The Ichimoku Kijun at GBX550.1 marks immediate support. Momentum readings from MACD and ADX remain bullish. RSI is neutral, but both Stochastic RSI and CCI are overbought, highlighting the possibility of a short-term pullback. Bull/Bear Power stands positive at 4.61, indicating intraday buyer strength. The Awesome Oscillator continues to support the prevailing bullish trend, but the overbought oscillators generate mixed signals for the near term.
Uptrend faces resistance as short-term pullback risk rises
Tesco is expected to consolidate within the GBX548.8 to GBX558.76 band in the short term, reflecting typical volatility around current levels. There is a very high probability for continued upward movement, though a brief pullback cannot be ruled out given the overheated oscillators. In the bullish scenario, a clean move through the upper bound could fuel additional gains, whereas a break below GBX548.8 support would open the way for a deeper correction.
Earlier, analysts noted that Tesco shares exhibited mixed momentum signals and a tendency toward short-term consolidation, with no clear directional conviction. The current analysis adds that technical conditions have turned decisively bullish, so traders should monitor for a sustained breakout above the recent consolidation band as the next signal for further upside.






Latest Tesco News





-
 Afghanistan
-
 Albania
-
 Algeria
-
 Angola
-
 Argentina
-
 Armenia
-
 Australia
-
 Austria
-
 Azerbaijan
-
 Bahamas
-
 Bahrain
-
 Bangladesh
-
 Belarus
-
 Belgium
-
 Bolivia
-
 Botswana
-
 Brazil
-
 Brunei
-
 Bulgaria
-
 Cambodia
-
 Cameroon
-
 Canada
-
 Chile
-
 China
-
 Colombia
-
 Congo
-
 Costa Rica
-
 Cote d'Ivoire
-
 Croatia
-
 Cuba
-
 Cyprus
-
 Czechia
-
 DR Congo
-
 Denmark
-
 Dominican Republic
-
 Ecuador
-
 Egypt
-
 El Salvador
-
 Estonia
-
 Eswatini
-
 Ethiopia
-
 Finland
-
 France
-
 Georgia
-
 Germany
-
 Ghana
-
 Greece
-
 Haiti
-
 Hong Kong
-
 Hungary
-
 India
-
 Indonesia
-
 Iran, Islamic republic
-
 Iraq
-
 Ireland
-
 Israel
-
 Italy
-
 Jamaica
-
 Japan
-
 Jordan
-
 Kazakhstan
-
 Kenya
-
 Korea
-
 Kuwait
-
 Kyrgyzstan
-
 Laos
-
 Latvia
-
 Lebanon
-
 Lesotho
-
 Libya
-
 Lithuania
-
 Luxembourg
-
 Madagascar
-
 Malaysia
-
 Malta
-
 Mauritius
-
 Mexico
-
 Moldova
-
 Mongolia
-
 Montenegro
-
 Morocco
-
 Mozambique
-
 Myanmar
-
 Namibia
-
 Nepal
-
 Netherlands
-
 New Zealand
-
 Nigeria
-
 North Macedonia
-
 Norway
-
 Oman
-
 Pakistan
-
 Palestine
-
 Panama
-
 Papua New Guinea
-
 Paraguay
-
 Peru
-
 Philippines
-
 Poland
-
 Portugal
-
 Puerto Rico
-
 Qatar
-
 Reunion
-
 Romania
-
 Rwanda
-
 Saudi Arabia
-
 Serbia
-
 Singapore
-
 Slovakia
-
 Slovenia
-
 Somalia
-
 South Africa
-
 Spain
-
 Sri Lanka
-
 Sweden
-
 Switzerland
-
 Syria
-
 Taiwan
-
 Tajikistan
-
 Tanzania
-
 Thailand
-
 Trinidad and Tobago
-
 Tunisia
-
 Turkey
-
 UAE
-
 Uganda
-
 Ukraine
-
 United Kingdom
-
United States
-
 Uruguay
-
 Uzbekistan
-
 Venezuela
-
 Vietnam
-
 Yemen
-
 Zambia
-
 Zimbabwe
- Forex
- Crypto












