


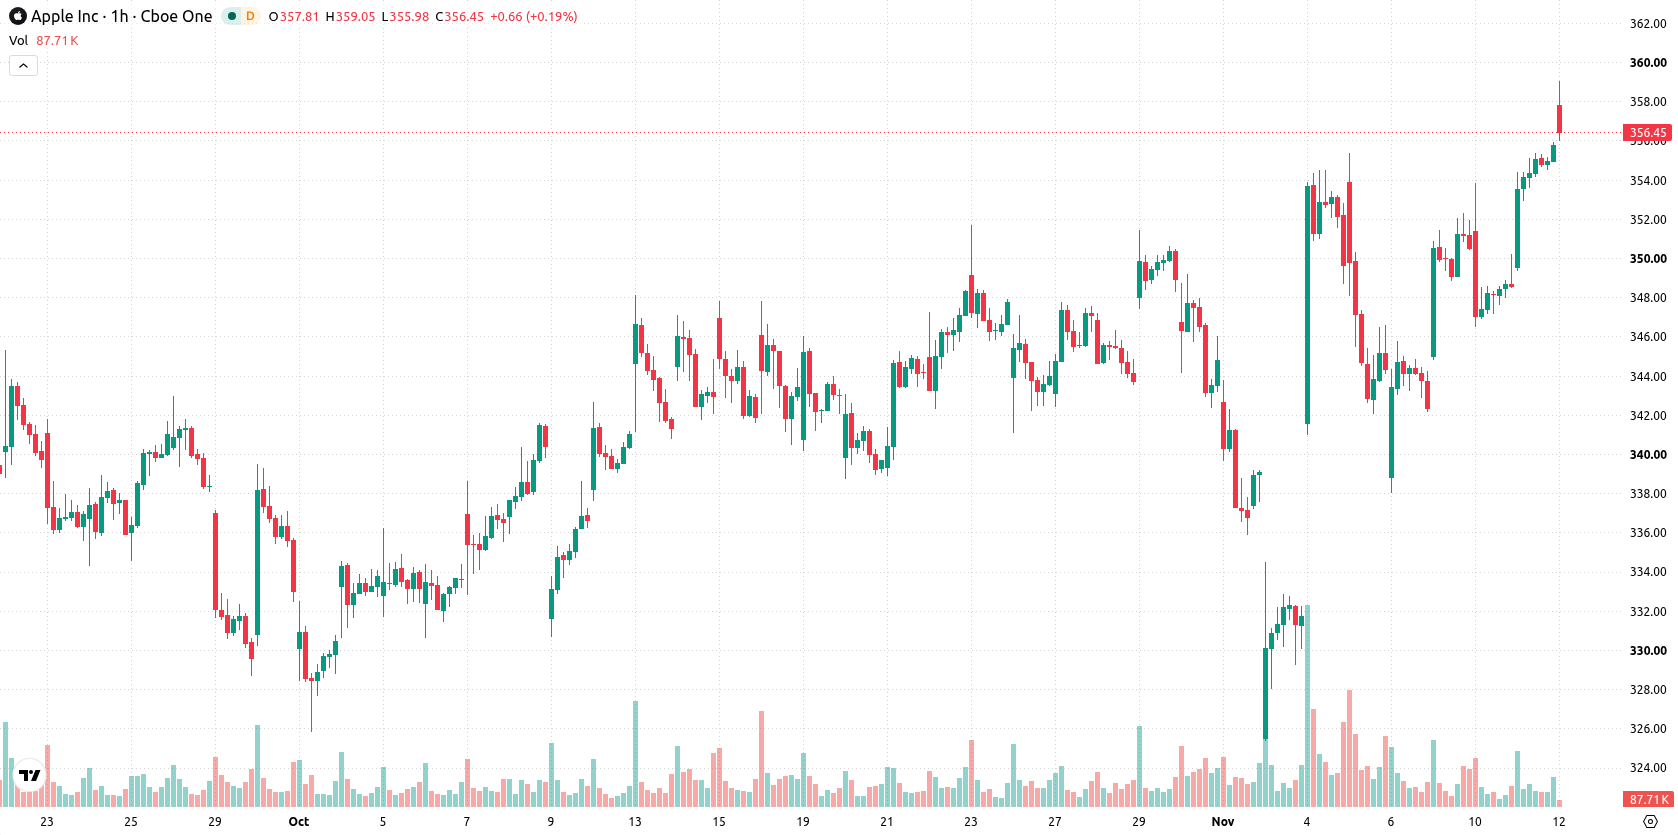
Apple Inc. (AAPL) stock is trading at $355.78, up 2.04% for the session after an opening gap higher. The price remains above its key short-term and medium-term moving averages, highlighting persistent upside momentum as shares trade near today's peak.
 360.34
Highlights
- Apple stock reached a $5 trillion market capitalization as investors assessed recent AI initiatives, borrowing, and share buybacks.
- ETFs made substantial net purchases of $460.3 million and $716.3 million on consecutive days, supporting upward trading momentum.
- Apple stock shows strong short-, medium-, and long-term bullish signals, with an expected trading range of $348.78 to $362.78.
Large investor inflows rise as AI strategy and buybacks gain traction
Apple's market capitalization crossed the $5 trillion threshold as investors assessed the company's new AI initiatives, recent borrowing decisions, and ongoing share buybacks, according to Ibtimes Com. This combination of strategic investment in innovation, capital structure optimization, and direct returns to shareholders enhances Apple's long-term positioning and draws increased interest from large investors. Additionally, ETFs initiated substantial inflows with net purchases of $460.3 million and $716.3 million on consecutive days, as reported by Yahoo Finance and Gurufocus, further supporting trading momentum in the stock.
Bullish technical setup faces overbought signals and exhaustion risk
On the technical front, AAPL/USD trades above the MA-20 and MA-50 on the hourly chart, while maintaining a wide cushion above the daily MA-200. The Ichimoku Kijun is positioned at $349.11, acting as immediate support. MACD and ADX both confirm a bullish setup, while the RSI remains neutral. However, Stoch RSI and CCI are both in overbought territory, highlighting potential overheating concerns. Bull/Bear Power and the Awesome Oscillator indicate that buyers have dominated intraday flows. Mixed signals emerge as some oscillators warn of exhaustion despite prevailing upside strength.
Consolidation favored as breakout levels define directional bias
Looking ahead, the short-term pricing scenarios for AAPL suggest consolidation within an expected range of $348.78 to $362.78 over the next few sessions. The probability of a continued uptrend is estimated at 79%, with a less likely downside move. The baseline scenario anticipates price action holding within the established volatility band. A breakout above $362.78 would signal resumption of buying momentum, while a move below $348.78 could test the underlying support defined by the Ichimoku Kijun.
Earlier, analysts noted that Apple's valuation was considered reasonable due to its enduring customer loyalty, earnings durability, and robust shareholder returns. With the latest technical signals confirming prevailing upside strength, traders should monitor the $348.78 to $362.78 range for signs of either continued momentum or a near-term reversal as volatility persists.











-
 Afghanistan
-
 Albania
-
 Algeria
-
 Angola
-
 Argentina
-
 Armenia
-
 Australia
-
 Austria
-
 Azerbaijan
-
 Bahamas
-
 Bahrain
-
 Bangladesh
-
 Belarus
-
 Belgium
-
 Bolivia
-
 Botswana
-
 Brazil
-
 Brunei
-
 Bulgaria
-
 Cambodia
-
 Cameroon
-
 Canada
-
 Chile
-
 China
-
 Colombia
-
 Congo
-
 Costa Rica
-
 Cote d'Ivoire
-
 Croatia
-
 Cuba
-
 Cyprus
-
 Czechia
-
 DR Congo
-
 Denmark
-
 Dominican Republic
-
 Ecuador
-
 Egypt
-
 El Salvador
-
 Estonia
-
 Eswatini
-
 Ethiopia
-
 Finland
-
 France
-
 Georgia
-
 Germany
-
 Ghana
-
 Greece
-
 Haiti
-
 Hong Kong
-
 Hungary
-
 India
-
 Indonesia
-
 Iran, Islamic republic
-
 Iraq
-
 Ireland
-
 Israel
-
 Italy
-
 Jamaica
-
 Japan
-
 Jordan
-
 Kazakhstan
-
 Kenya
-
 Korea
-
 Kuwait
-
 Kyrgyzstan
-
 Laos
-
 Latvia
-
 Lebanon
-
 Lesotho
-
 Libya
-
 Lithuania
-
 Luxembourg
-
 Madagascar
-
 Malaysia
-
 Malta
-
 Mauritius
-
 Mexico
-
 Moldova
-
 Mongolia
-
 Montenegro
-
 Morocco
-
 Mozambique
-
 Myanmar
-
 Namibia
-
 Nepal
-
 Netherlands
-
 New Zealand
-
 Nigeria
-
 North Macedonia
-
 Norway
-
 Oman
-
 Pakistan
-
 Palestine
-
 Panama
-
 Papua New Guinea
-
 Paraguay
-
 Peru
-
 Philippines
-
 Poland
-
 Portugal
-
 Puerto Rico
-
 Qatar
-
 Reunion
-
 Romania
-
 Rwanda
-
 Saudi Arabia
-
 Serbia
-
 Singapore
-
 Slovakia
-
 Slovenia
-
 Somalia
-
 South Africa
-
 Spain
-
 Sri Lanka
-
 Sweden
-
 Switzerland
-
 Syria
-
 Taiwan
-
 Tajikistan
-
 Tanzania
-
 Thailand
-
 Trinidad and Tobago
-
 Tunisia
-
 Turkey
-
 UAE
-
 Uganda
-
 Ukraine
-
 United Kingdom
-
United States
-
 Uruguay
-
 Uzbekistan
-
 Venezuela
-
 Vietnam
-
 Yemen
-
 Zambia
-
 Zimbabwe
- Forex
- Crypto












