


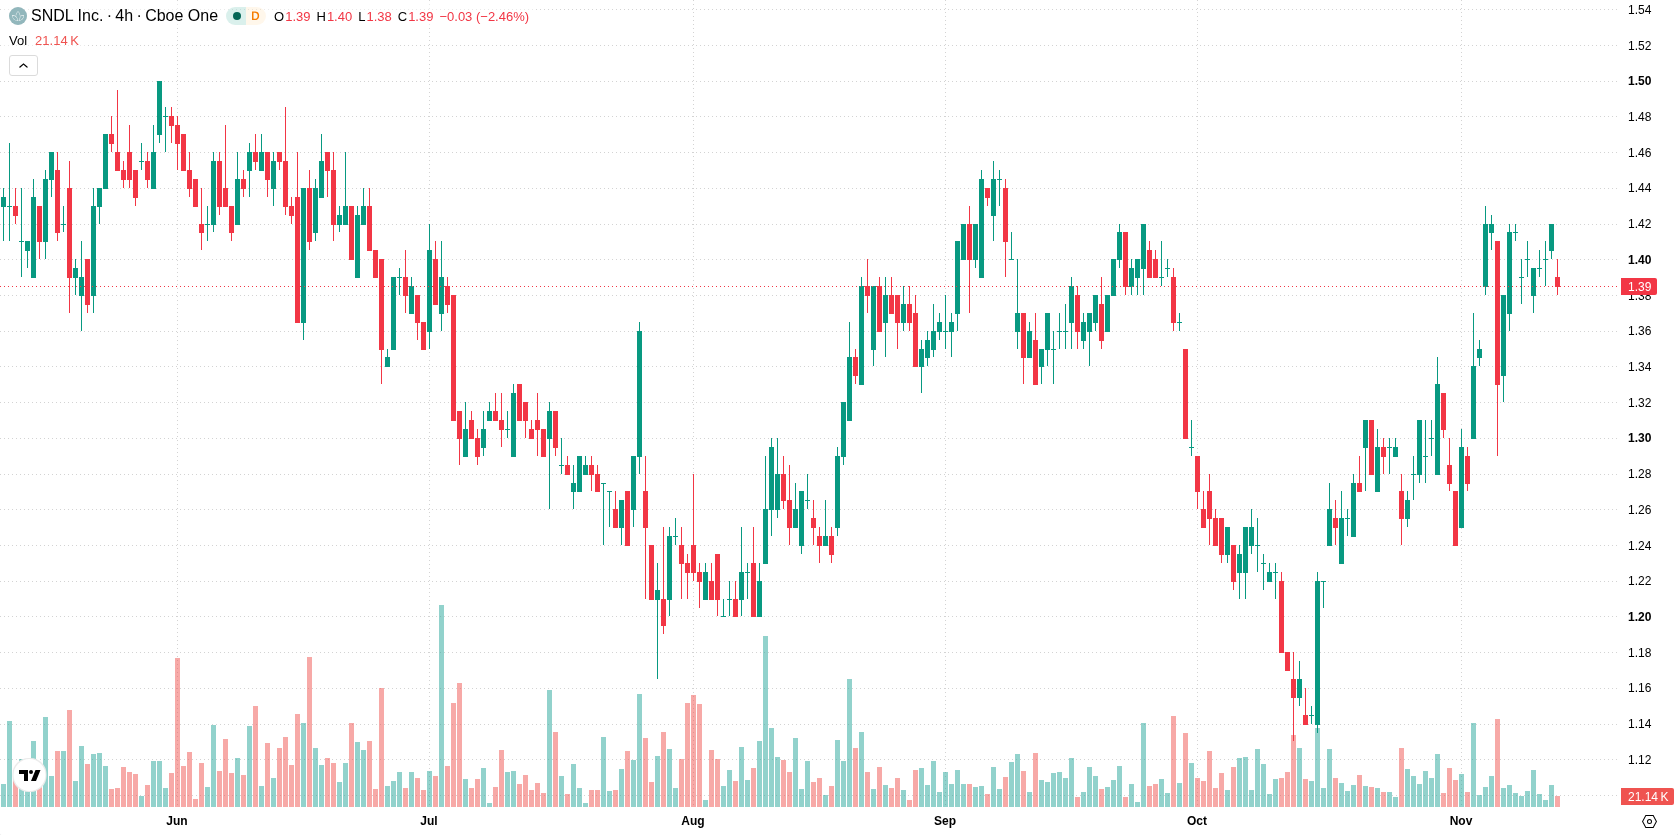
SNDL Inc. (SNDL) fell 3.17% as intraday selling followed a downside gap and pressured sentiment, even as recent news included record free cash flow and a debt-free balance sheet. The retreat remains limited by persistent support above the 20- and 50-day moving averages, with lingering resistance just below the 200-day average capping upside momentum.
 1.39
1.42
Highlights
- SNDL reported record quarterly free cash flow of CAD 20 million, remains debt free, and achieved improved operational efficiency.
- A regulatory settlement in Ontario will cut reported revenue by CAD 105 million with minimal effect on operating profit.
- SNDL stock trades in a short- and medium-term bullish pattern but faces overbought technicals and forecasted range of $1.35 to $1.41 over the next five days.
Share buybacks and regulatory adjustments shape flows amid selling pressure
SNDL reported record quarterly free cash flow of CAD 20 million and highlighted its debt-free balance sheet along with improved operational efficiency. The company finalized a regulatory settlement in Ontario that will reduce reported revenue by CAD 105 million but have minimal impact on operating profit. SNDL also increased its indirect equity stake in Parallel to 92% and repurchased 5.4 million common shares in the quarter, though price action has remained under broader selling pressure.
Bullish structure softens as overbought signals confront neutral trend
SNDL is trading above both its 20-day and 50-day moving averages at $1.32, but is just below its 200-day moving average at $1.39. This positioning indicates short- and medium-term bullish structure but lingering long-term resistance, with the near-term ceiling at $1.39 and support around the week low at $1.36. Momentum indicators present a mixed picture: the MACD gives a Buy forecast, suggesting positive short-term momentum, but the Average Directional Index (ADX) is neutral, pointing to a lack of strong trend. The Relative Strength Index (RSI) is neutral, while both the Stochastic RSI and Commodity Channel Index (CCI) are in the overbought zone, indicating potential for a downside correction or overheating risk. Bull/Bear Power (BBP) is positive, meaning buyers dominate intraday momentum, and the Awesome Oscillator (AO) is neutral. Today, the stock is down at $1.38, slipping 3.17% from the previous close, having opened with a downside gap of about 2.11%. Price is trading near the day's low, intraday volatility stands at 2.16%, and the tone is pressured after the open. These intraday losses add caution given the overbought signals from CCI and Stochastic RSI, contrasting with otherwise bullish momentum inputs.
Previously it was reported that SNDL exhibited sustained upward momentum supported by share buybacks and improving fundamentals, though technical signals indicated potential for a short-term correction. The present move beneath the 200-day moving average and recent downside gap introduce heightened volatility, making price action near $1.39 a critical level to watch for any shift in trend direction.









-
 Afghanistan
-
 Albania
-
 Algeria
-
 Angola
-
 Argentina
-
 Armenia
-
 Australia
-
 Austria
-
 Azerbaijan
-
 Bahamas
-
 Bahrain
-
 Bangladesh
-
 Belarus
-
 Belgium
-
 Bolivia
-
 Botswana
-
 Brazil
-
 Brunei
-
 Bulgaria
-
 Cambodia
-
 Cameroon
-
 Canada
-
 Chile
-
 China
-
 Colombia
-
 Congo
-
 Costa Rica
-
 Cote d'Ivoire
-
 Croatia
-
 Cuba
-
 Cyprus
-
 Czechia
-
 DR Congo
-
 Denmark
-
 Dominican Republic
-
 Ecuador
-
 Egypt
-
 El Salvador
-
 Estonia
-
 Eswatini
-
 Ethiopia
-
 Finland
-
 France
-
 Georgia
-
 Germany
-
 Ghana
-
 Greece
-
 Haiti
-
 Hong Kong
-
 Hungary
-
 India
-
 Indonesia
-
 Iran, Islamic republic
-
 Iraq
-
 Ireland
-
 Israel
-
 Italy
-
 Jamaica
-
 Japan
-
 Jordan
-
 Kazakhstan
-
 Kenya
-
 Korea
-
 Kuwait
-
 Kyrgyzstan
-
 Laos
-
 Latvia
-
 Lebanon
-
 Lesotho
-
 Libya
-
 Lithuania
-
 Luxembourg
-
 Madagascar
-
 Malaysia
-
 Malta
-
 Mauritius
-
 Mexico
-
 Moldova
-
 Mongolia
-
 Montenegro
-
 Morocco
-
 Mozambique
-
 Myanmar
-
 Namibia
-
 Nepal
-
 Netherlands
-
 New Zealand
-
 Nigeria
-
 North Macedonia
-
 Norway
-
 Oman
-
 Pakistan
-
 Palestine
-
 Panama
-
 Papua New Guinea
-
 Paraguay
-
 Peru
-
 Philippines
-
 Poland
-
 Portugal
-
 Puerto Rico
-
 Qatar
-
 Reunion
-
 Romania
-
 Rwanda
-
 Saudi Arabia
-
 Serbia
-
 Singapore
-
 Slovakia
-
 Slovenia
-
 Somalia
-
 South Africa
-
 Spain
-
 Sri Lanka
-
 Sweden
-
 Switzerland
-
 Syria
-
 Taiwan
-
 Tajikistan
-
 Tanzania
-
 Thailand
-
 Trinidad and Tobago
-
 Tunisia
-
 Turkey
-
 UAE
-
 Uganda
-
 Ukraine
-
 United Kingdom
-
United States
-
 Uruguay
-
 Uzbekistan
-
 Venezuela
-
 Vietnam
-
 Yemen
-
 Zambia
-
 Zimbabwe
- Forex
- Crypto












