

SNDL stock dips below key average as weak momentum persists

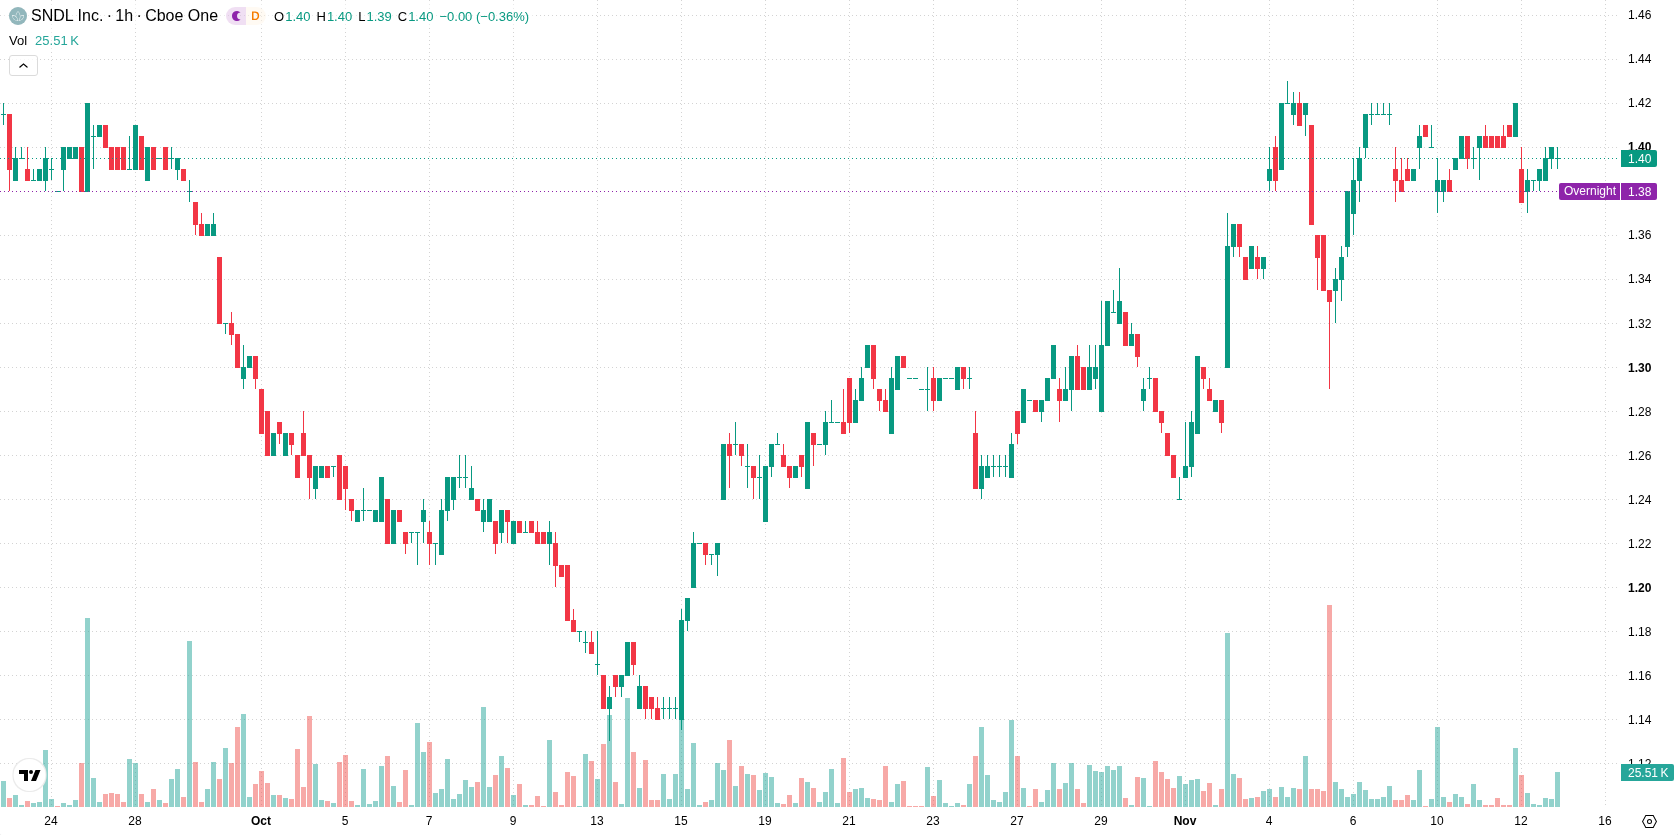
SNDL Inc. (SNDL) stock is trading at $1.39, reflecting a daily decline of 2.11%. Shares are positioned below their short-term moving average but remain supported by medium- and long-term trend indicators.
 1.38
1.42
Highlights
- SNDL stock is trading under short-term pressure but maintains medium- and long-term technical support levels.
- Bullish momentum is indicated by MACD while most oscillators remain neutral, resulting in mixed technical signals.
- SNDL stock is expected to trade between $1.36 to $1.42 with a 45% probability of an upward move.
Bullish momentum offset by neutral technical signals
Technically, SNDL is trading below the MA-20, while still holding above both the MA-50 and MA-200, indicating recent short-term pressure against continued support from broader trend levels. Immediate resistance is identified at the Ichimoku Kijun level of $1.40. The MACD points to strong bullish momentum, but the ADX remains neutral, reflecting uncertainty in trend direction. Oscillators including RSI, Stoch RSI, and CCI all register neutral readings in their respective validated zones, while Bull/Bear Power is just above zero, suggesting mild intraday buyer presence. The Awesome Oscillator is neutral, and today's session was marked by a 2.11% slip and a $0.03 gap down, with price closing near the middle of the daily range amidst moderate volatility. In sum, the technical landscape offers a mix of signals, with bullish momentum offset somewhat by neutral oscillators and lack of decisive directional strength.
Slight downside risk as consolidation range holds
Over the coming days, the expected trading range is defined between $1.36 and $1.42, reflecting typical volatility band relative to current levels. There is a 45% probability for an upward price move, implying a slightly higher chance of further downside in the near term. As long as SNDL remains confined within this range, price action is likely to consolidate. A breakout above $1.40 would trigger a bullish scenario, whereas a close below $1.36 would tip the outlook bearish.
Previously it was reported that SNDL's price action was shaped by a balance of bullish momentum and caution signals, with key support levels containing volatility. The current analysis reinforces this mixed outlook and highlights that sustained consolidation or a decisive breakout above $1.40 remains critical for the next directional move.








-
 Afghanistan
-
 Albania
-
 Algeria
-
 Angola
-
 Argentina
-
 Armenia
-
 Australia
-
 Austria
-
 Azerbaijan
-
 Bahamas
-
 Bahrain
-
 Bangladesh
-
 Belarus
-
 Belgium
-
 Bolivia
-
 Botswana
-
 Brazil
-
 Brunei
-
 Bulgaria
-
 Cambodia
-
 Cameroon
-
 Canada
-
 Chile
-
 China
-
 Colombia
-
 Congo
-
 Costa Rica
-
 Cote d'Ivoire
-
 Croatia
-
 Cuba
-
 Cyprus
-
 Czechia
-
 DR Congo
-
 Denmark
-
 Dominican Republic
-
 Ecuador
-
 Egypt
-
 El Salvador
-
 Estonia
-
 Eswatini
-
 Ethiopia
-
 Finland
-
 France
-
 Georgia
-
 Germany
-
 Ghana
-
 Greece
-
 Haiti
-
 Hong Kong
-
 Hungary
-
 India
-
 Indonesia
-
 Iran, Islamic republic
-
 Iraq
-
 Ireland
-
 Israel
-
 Italy
-
 Jamaica
-
 Japan
-
 Jordan
-
 Kazakhstan
-
 Kenya
-
 Korea
-
 Kuwait
-
 Kyrgyzstan
-
 Laos
-
 Latvia
-
 Lebanon
-
 Lesotho
-
 Libya
-
 Lithuania
-
 Luxembourg
-
 Madagascar
-
 Malaysia
-
 Malta
-
 Mauritius
-
 Mexico
-
 Moldova
-
 Mongolia
-
 Montenegro
-
 Morocco
-
 Mozambique
-
 Myanmar
-
 Namibia
-
 Nepal
-
 Netherlands
-
 New Zealand
-
 Nigeria
-
 North Macedonia
-
 Norway
-
 Oman
-
 Pakistan
-
 Palestine
-
 Panama
-
 Papua New Guinea
-
 Paraguay
-
 Peru
-
 Philippines
-
 Poland
-
 Portugal
-
 Puerto Rico
-
 Qatar
-
 Reunion
-
 Romania
-
 Rwanda
-
 Saudi Arabia
-
 Serbia
-
 Singapore
-
 Slovakia
-
 Slovenia
-
 Somalia
-
 South Africa
-
 Spain
-
 Sri Lanka
-
 Sweden
-
 Switzerland
-
 Syria
-
 Taiwan
-
 Tajikistan
-
 Tanzania
-
 Thailand
-
 Trinidad and Tobago
-
 Tunisia
-
 Turkey
-
 UAE
-
 Uganda
-
 Ukraine
-
 United Kingdom
-
United States
-
 Uruguay
-
 Uzbekistan
-
 Venezuela
-
 Vietnam
-
 Yemen
-
 Zambia
-
 Zimbabwe
- Forex
- Crypto












