

Can Microsoft overtaking Nvidia in market value support MSFT stock?

Microsoft (MSFT) stock is trading at $528.51, marking a daily gain of 1.42%. The price sits below its key short-term averages but holds above the major long-term moving average.
 526.30
548.27
Highlights
- Microsoft will increase its quarterly dividend to $0.98 per share, with a record date of November 19 and payment on December 10.
- The company is participating as a strategic buyer in Anthropic's $26 billion concurrent placement and advancing a delayed data center partnership with Chevron.
- Microsoft stock trades with mixed short-term technical signals, an expected range of $515.17 to $541.85, and a 55% probability of a move lower.
Dividend hike and tech alliances spur institutional positioning and sentiment
Microsoft's decision to raise its quarterly dividend to $0.98 per share, payable on December 10 to holders of record as of November 19, delivers higher shareholder returns and may drive institutional demand in the weeks leading up to the record date. The company has also been included as a strategic buyer in Anthropic's $26 billion concurrent placement, highlighting Microsoft's continued prominence in high-profile technology alliances and contributing to positive sentiment toward the stock, according to Yahoo Finance. Separately, Microsoft is advancing its data center expansion through a partnership with Chevron in West Texas, though this project faces delays due to a state-imposed moratorium, as reported by Gurufocus. The stock's recent move to surpass Nvidia in market value further underscores its leadership position among global technology companies.
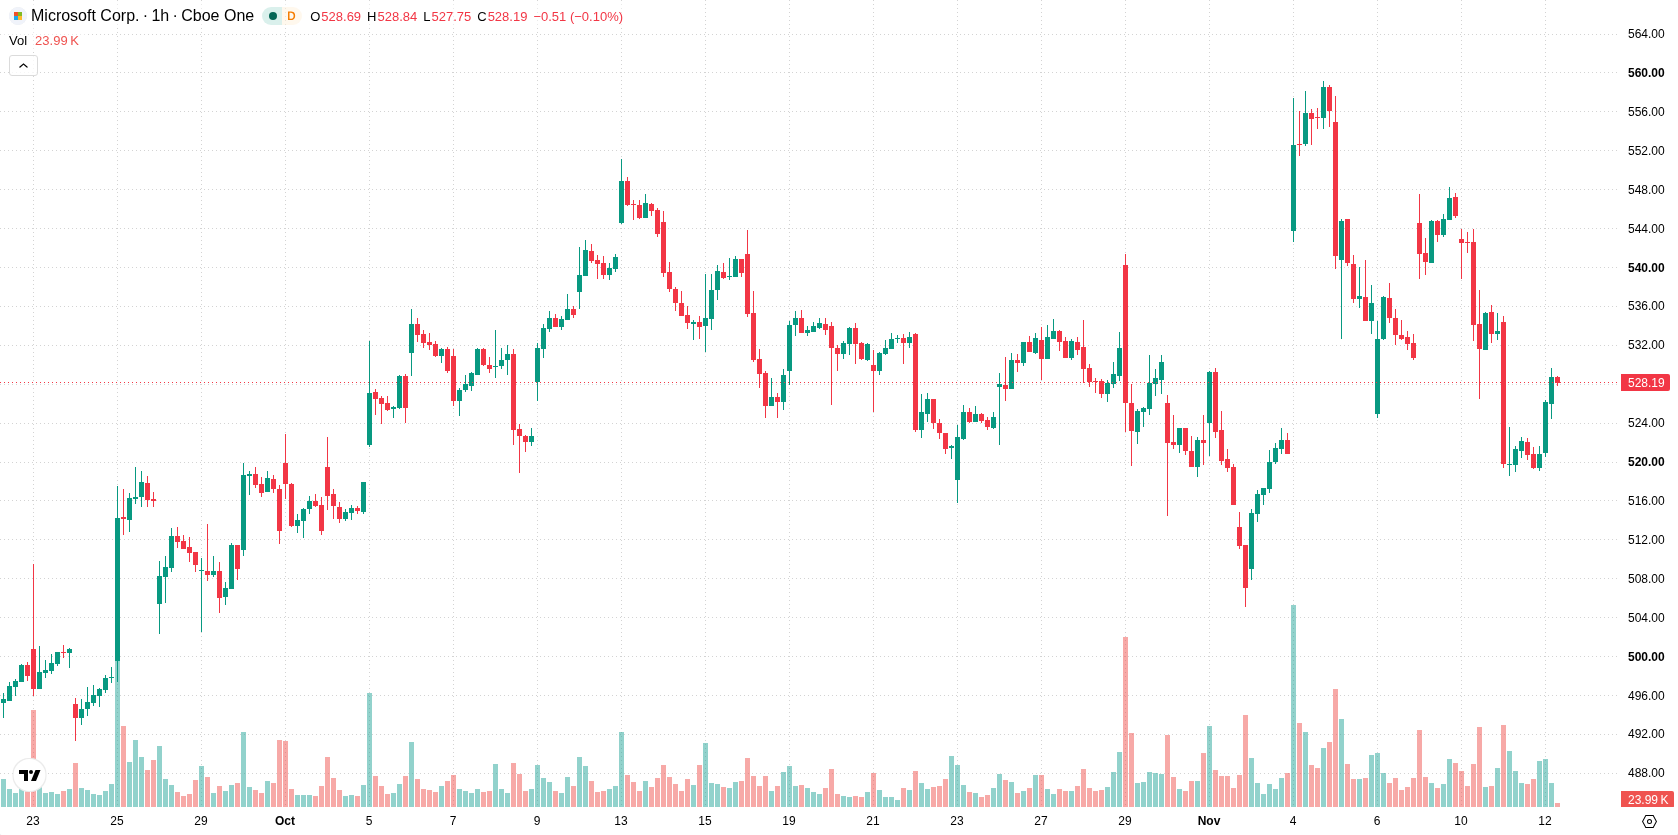
Resistance caps recovery as mixed momentum tempers near-term outlook
On the technical front, MSFT is trading below its MA-20 and MA-50 on the h1 timeframe while remaining above the major MA-200 support. The daily chart continues to display a bullish structure, with immediate resistance set at the Ichimoku Kijun on the D1 timeframe at $533.37. Momentum signals are mixed: MACD and ADX show selling pressure, while RSI, Stochastic RSI, and CCI remain neutral, indicating no dominant momentum. Intraday action is characterized by Bull/Bear Power at -0.3, favoring sellers, while the Awesome Oscillator does not provide further directional clarity.
Consolidation expected as upside faces resistance and downside risk rises
In the near term, MSFT is expected to trade within a band of $515.17 to $541.85, in line with typical volatility. The probability of a further upward move stands at 45%, while a pullback to lower levels is slightly more likely at 55%. The baseline expectation is for the price to consolidate in this corridor, with a move above $533.37 opening the door for potential gains, while a breakdown below $515.17 may trigger another leg down.
Earlier, analysts noted that Microsoft faced heightened competition in enterprise AI but maintained a broadly constructive outlook for the stock, with attention on catalysts such as product innovation and partnerships. The current technical and fundamental setup indicates MSFT is likely to consolidate in the $515.17 to $541.85 range, making a decisive move above $533.37 or below $515.17 the key levels to watch for shift in trend.






Latest Microsoft News



-
 Afghanistan
-
 Albania
-
 Algeria
-
 Angola
-
 Argentina
-
 Armenia
-
 Australia
-
 Austria
-
 Azerbaijan
-
 Bahamas
-
 Bahrain
-
 Bangladesh
-
 Belarus
-
 Belgium
-
 Bolivia
-
 Botswana
-
 Brazil
-
 Brunei
-
 Bulgaria
-
 Cambodia
-
 Cameroon
-
 Canada
-
 Chile
-
 China
-
 Colombia
-
 Congo
-
 Costa Rica
-
 Cote d'Ivoire
-
 Croatia
-
 Cuba
-
 Cyprus
-
 Czechia
-
 DR Congo
-
 Denmark
-
 Dominican Republic
-
 Ecuador
-
 Egypt
-
 El Salvador
-
 Estonia
-
 Eswatini
-
 Ethiopia
-
 Finland
-
 France
-
 Georgia
-
 Germany
-
 Ghana
-
 Greece
-
 Haiti
-
 Hong Kong
-
 Hungary
-
 India
-
 Indonesia
-
 Iran, Islamic republic
-
 Iraq
-
 Ireland
-
 Israel
-
 Italy
-
 Jamaica
-
 Japan
-
 Jordan
-
 Kazakhstan
-
 Kenya
-
 Korea
-
 Kuwait
-
 Kyrgyzstan
-
 Laos
-
 Latvia
-
 Lebanon
-
 Lesotho
-
 Libya
-
 Lithuania
-
 Luxembourg
-
 Madagascar
-
 Malaysia
-
 Malta
-
 Mauritius
-
 Mexico
-
 Moldova
-
 Mongolia
-
 Montenegro
-
 Morocco
-
 Mozambique
-
 Myanmar
-
 Namibia
-
 Nepal
-
 Netherlands
-
 New Zealand
-
 Nigeria
-
 North Macedonia
-
 Norway
-
 Oman
-
 Pakistan
-
 Palestine
-
 Panama
-
 Papua New Guinea
-
 Paraguay
-
 Peru
-
 Philippines
-
 Poland
-
 Portugal
-
 Puerto Rico
-
 Qatar
-
 Reunion
-
 Romania
-
 Rwanda
-
 Saudi Arabia
-
 Serbia
-
 Singapore
-
 Slovakia
-
 Slovenia
-
 Somalia
-
 South Africa
-
 Spain
-
 Sri Lanka
-
 Sweden
-
 Switzerland
-
 Syria
-
 Taiwan
-
 Tajikistan
-
 Tanzania
-
 Thailand
-
 Trinidad and Tobago
-
 Tunisia
-
 Turkey
-
 UAE
-
 Uganda
-
 Ukraine
-
 United Kingdom
-
United States
-
 Uruguay
-
 Uzbekistan
-
 Venezuela
-
 Vietnam
-
 Yemen
-
 Zambia
-
 Zimbabwe
- Forex
- Crypto












