


Delta Air Lines Inc (DAL) slid 4.96% today under heavy selling pressure, marking a sharp move as downside momentum emerged after the open. This reversal contradicts the underlying bullish structure indicated by prices remaining above all major moving averages and further upside signals from most momentum indicators.
 87.74
92.48
Highlights
- Shares of Delta Air Lines trade above key moving averages, indicating persistent upward momentum across multiple timeframes.
- Technical indicators show bullish momentum but overbought signals in the Stochastic RSI and CCI suggest short-term correction risk.
- After dropping 4.96% to $86.78 today, the price is expected to move between $83.48 and $90.08 over the next 5 trading days.
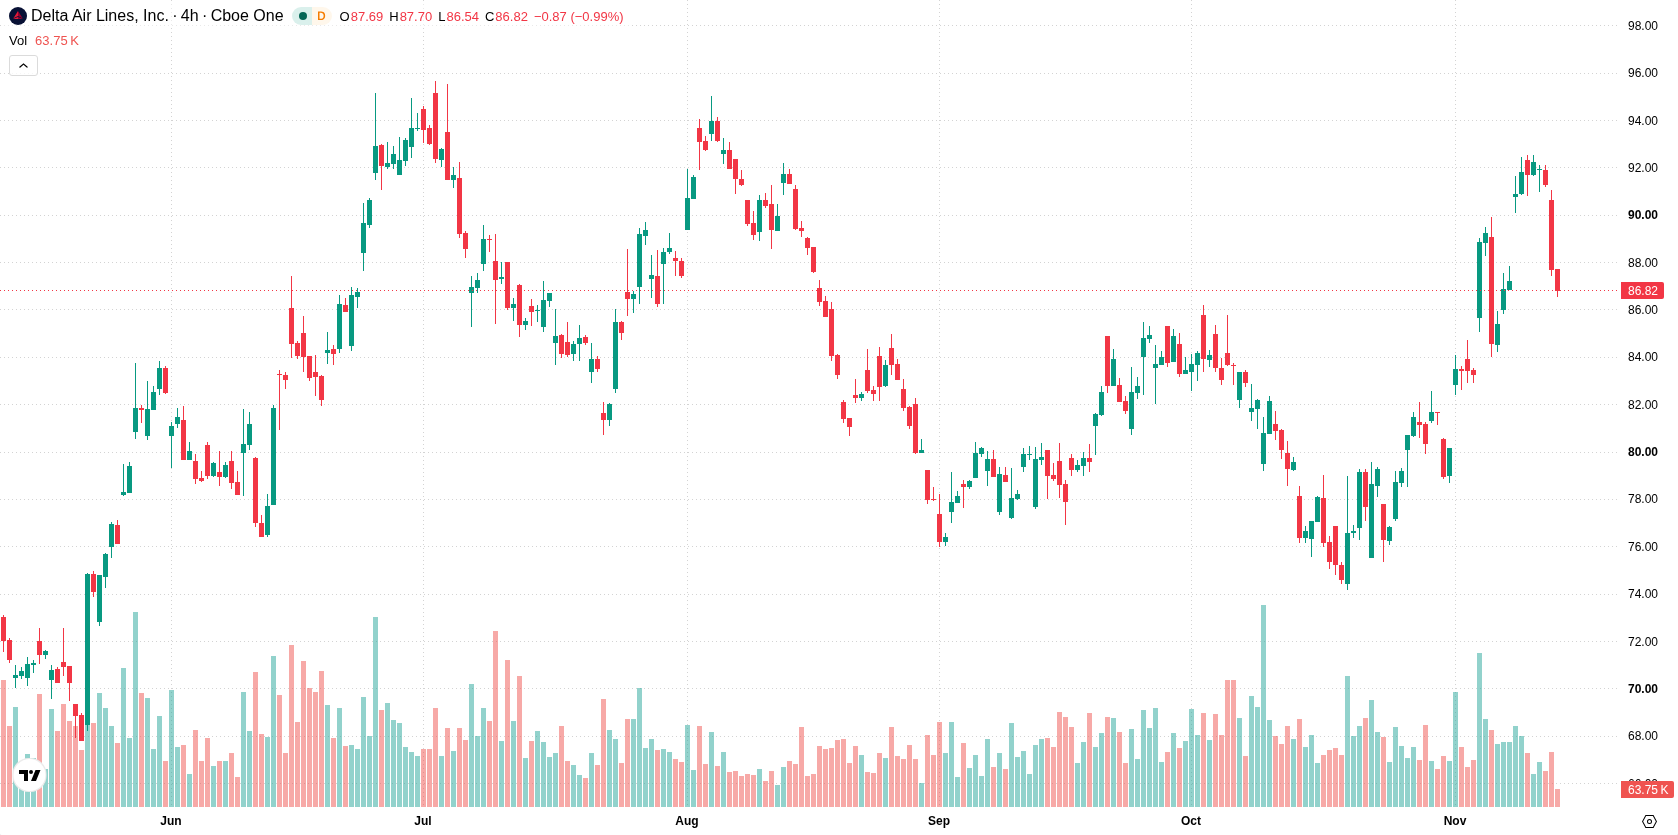
Uptrend persists with overbought signals and rising volatility
Delta Air Lines is trading above its 20-day, 50-day, and 200-day moving averages at $82.26, $81.61, and $77.47, respectively, pointing to persistent bullish momentum across all timeframes. The stock faces immediate resistance at $87.48 and has support at $85.89, while the longer-term alignment between the 50-day and 200-day averages provides additional structural support for the uptrend. Momentum indicators such as MACD and ADX confirm ongoing buying momentum, and the Awesome Oscillator also favors the prevailing trend. The RSI is neutral, but both Stochastic RSI and Commodity Channel Index (CCI) are overbought, which introduces short-term correction risk. Bull/Bear Power reflects intraday buyer dominance, yet today's session saw the price fall to $86.78, close to intraday lows, as volatility spiked to 4.06%.
Previously it was reported that Delta Air Lines was experiencing strong upside momentum, supported by bullish technical signals and expanding international routes. The current analysis introduces increased volatility and a sharp intraday reversal, highlighting the importance of monitoring the $85.89 support and $87.48 resistance levels as potential catalysts for the next directional move.






Latest Delta Air Lines News





-
 Afghanistan
-
 Albania
-
 Algeria
-
 Angola
-
 Argentina
-
 Armenia
-
 Australia
-
 Austria
-
 Azerbaijan
-
 Bahamas
-
 Bahrain
-
 Bangladesh
-
 Belarus
-
 Belgium
-
 Bolivia
-
 Botswana
-
 Brazil
-
 Brunei
-
 Bulgaria
-
 Cambodia
-
 Cameroon
-
 Canada
-
 Chile
-
 China
-
 Colombia
-
 Congo
-
 Costa Rica
-
 Cote d'Ivoire
-
 Croatia
-
 Cuba
-
 Cyprus
-
 Czechia
-
 DR Congo
-
 Denmark
-
 Dominican Republic
-
 Ecuador
-
 Egypt
-
 El Salvador
-
 Estonia
-
 Eswatini
-
 Ethiopia
-
 Finland
-
 France
-
 Georgia
-
 Germany
-
 Ghana
-
 Greece
-
 Haiti
-
 Hong Kong
-
 Hungary
-
 India
-
 Indonesia
-
 Iran, Islamic republic
-
 Iraq
-
 Ireland
-
 Israel
-
 Italy
-
 Jamaica
-
 Japan
-
 Jordan
-
 Kazakhstan
-
 Kenya
-
 Korea
-
 Kuwait
-
 Kyrgyzstan
-
 Laos
-
 Latvia
-
 Lebanon
-
 Lesotho
-
 Libya
-
 Lithuania
-
 Luxembourg
-
 Madagascar
-
 Malaysia
-
 Malta
-
 Mauritius
-
 Mexico
-
 Moldova
-
 Mongolia
-
 Montenegro
-
 Morocco
-
 Mozambique
-
 Myanmar
-
 Namibia
-
 Nepal
-
 Netherlands
-
 New Zealand
-
 Nigeria
-
 North Macedonia
-
 Norway
-
 Oman
-
 Pakistan
-
 Palestine
-
 Panama
-
 Papua New Guinea
-
 Paraguay
-
 Peru
-
 Philippines
-
 Poland
-
 Portugal
-
 Puerto Rico
-
 Qatar
-
 Reunion
-
 Romania
-
 Rwanda
-
 Saudi Arabia
-
 Serbia
-
 Singapore
-
 Slovakia
-
 Slovenia
-
 Somalia
-
 South Africa
-
 Spain
-
 Sri Lanka
-
 Sweden
-
 Switzerland
-
 Syria
-
 Taiwan
-
 Tajikistan
-
 Tanzania
-
 Thailand
-
 Trinidad and Tobago
-
 Tunisia
-
 Turkey
-
 UAE
-
 Uganda
-
 Ukraine
-
 United Kingdom
-
United States
-
 Uruguay
-
 Uzbekistan
-
 Venezuela
-
 Vietnam
-
 Yemen
-
 Zambia
-
 Zimbabwe
- Forex
- Crypto












