

Why is Texas Instruments stock down 4.2% today?

Texas Instruments Inc. (TXN) fell 4.29% as dividend and institutional accumulation news provided a positive backdrop, even as selling pressure drove a sharp drop after the open. The decline is working against a structurally bullish technical profile, with price still supported above all major moving averages.
 312.00
316.97
Highlights
- Texas Instruments raised its annual dividend to $6.08 per share for a 2.0% yield, with a payout ratio of 78.86%.
- Institutional investors reported increased holdings in the third quarter as the company produced strong earnings and returns amid AI and data center growth.
- Shares of Texas Instruments trade above key moving averages, with price volatility elevated and an expected five-day range of $284.35 to $313.89.
Institutional accumulation and dividend hike support long-term optimism
Recent developments for Texas Instruments focused on its position as a strong dividend stock, highlighted by a rise in its annualized dividend to $6.08 and a yield near 2.0%, with a payout ratio of 78.86%. Institutional investors including Russell Investments Group Ltd., King Luther Capital Management Corp, and Banyan Capital Management Inc. reported increased holdings during the third quarter. The company also reported strong earnings growth and returns on invested capital, benefiting from rising AI and data center demand, and is evaluating its pricing approach for 2027 against industry capacity constraints, though price action has remained under broader selling pressure.
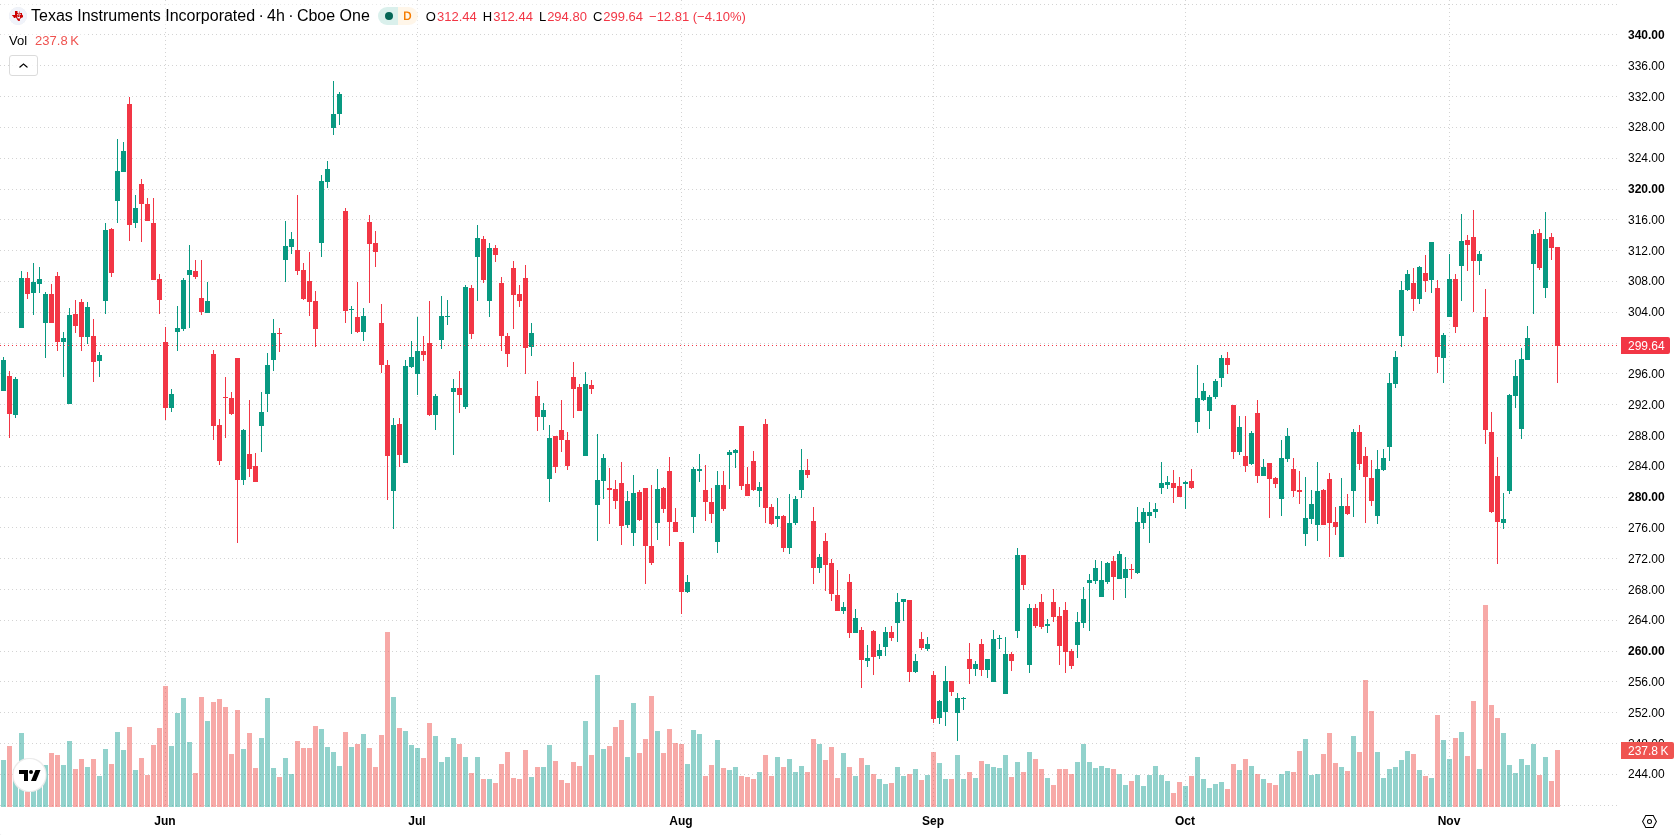
Mixed momentum signals as price holds above major support levels
Texas Instruments is trading above its 20-day ($295.46), 50-day ($282.85), and 200-day ($264.34) moving averages, confirming a bullish technical structure across all timeframes. Resistance is set near the session low at $306.77, while immediate support comes from the 20-day moving average at $295.46 and longer-term alignment between the 50- and 200-day averages reinforces the bullish bias. Momentum signals are mixed: the MACD suggests a buy, the Average Directional Index (ADX) is neutral, and the Relative Strength Index (RSI), Stochastic RSI, and Commodity Channel Index (CCI) are all neutral, indicating no current overbought or oversold conditions. Bull/Bear Power reflects intraday buying dominance, yet the Awesome Oscillator is neutral. After the downside gap, price has held near the session low within a daily volatility of 0.96%, and current action skews towards weakness without severe momentum extremes.
Earlier, analysts noted that Texas Instruments was exhibiting robust long-term bullish momentum supported by ongoing institutional accumulation, even as short-term selling pressure persisted. The current analysis reinforces this outlook with confirmation of continued institutional inflows and a bullish technical structure across all major timeframes, making the $295.46 support level essential to watch for signs of potential downside risk in the coming sessions.






Latest Texas Instruments News




-
 Afghanistan
-
 Albania
-
 Algeria
-
 Angola
-
 Argentina
-
 Armenia
-
 Australia
-
 Austria
-
 Azerbaijan
-
 Bahamas
-
 Bahrain
-
 Bangladesh
-
 Belarus
-
 Belgium
-
 Bolivia
-
 Botswana
-
 Brazil
-
 Brunei
-
 Bulgaria
-
 Cambodia
-
 Cameroon
-
 Canada
-
 Chile
-
 China
-
 Colombia
-
 Congo
-
 Costa Rica
-
 Cote d'Ivoire
-
 Croatia
-
 Cuba
-
 Cyprus
-
 Czechia
-
 DR Congo
-
 Denmark
-
 Dominican Republic
-
 Ecuador
-
 Egypt
-
 El Salvador
-
 Estonia
-
 Eswatini
-
 Ethiopia
-
 Finland
-
 France
-
 Georgia
-
 Germany
-
 Ghana
-
 Greece
-
 Haiti
-
 Hong Kong
-
 Hungary
-
 India
-
 Indonesia
-
 Iran, Islamic republic
-
 Iraq
-
 Ireland
-
 Israel
-
 Italy
-
 Jamaica
-
 Japan
-
 Jordan
-
 Kazakhstan
-
 Kenya
-
 Korea
-
 Kuwait
-
 Kyrgyzstan
-
 Laos
-
 Latvia
-
 Lebanon
-
 Lesotho
-
 Libya
-
 Lithuania
-
 Luxembourg
-
 Madagascar
-
 Malaysia
-
 Malta
-
 Mauritius
-
 Mexico
-
 Moldova
-
 Mongolia
-
 Montenegro
-
 Morocco
-
 Mozambique
-
 Myanmar
-
 Namibia
-
 Nepal
-
 Netherlands
-
 New Zealand
-
 Nigeria
-
 North Macedonia
-
 Norway
-
 Oman
-
 Pakistan
-
 Palestine
-
 Panama
-
 Papua New Guinea
-
 Paraguay
-
 Peru
-
 Philippines
-
 Poland
-
 Portugal
-
 Puerto Rico
-
 Qatar
-
 Reunion
-
 Romania
-
 Rwanda
-
 Saudi Arabia
-
 Serbia
-
 Singapore
-
 Slovakia
-
 Slovenia
-
 Somalia
-
 South Africa
-
 Spain
-
 Sri Lanka
-
 Sweden
-
 Switzerland
-
 Syria
-
 Taiwan
-
 Tajikistan
-
 Tanzania
-
 Thailand
-
 Trinidad and Tobago
-
 Tunisia
-
 Turkey
-
 UAE
-
 Uganda
-
 Ukraine
-
 United Kingdom
-
United States
-
 Uruguay
-
 Uzbekistan
-
 Venezuela
-
 Vietnam
-
 Yemen
-
 Zambia
-
 Zimbabwe
- Forex
- Crypto












