

AgEagle shares technical analysis: Seller pressure keeps focus on $0.31 support

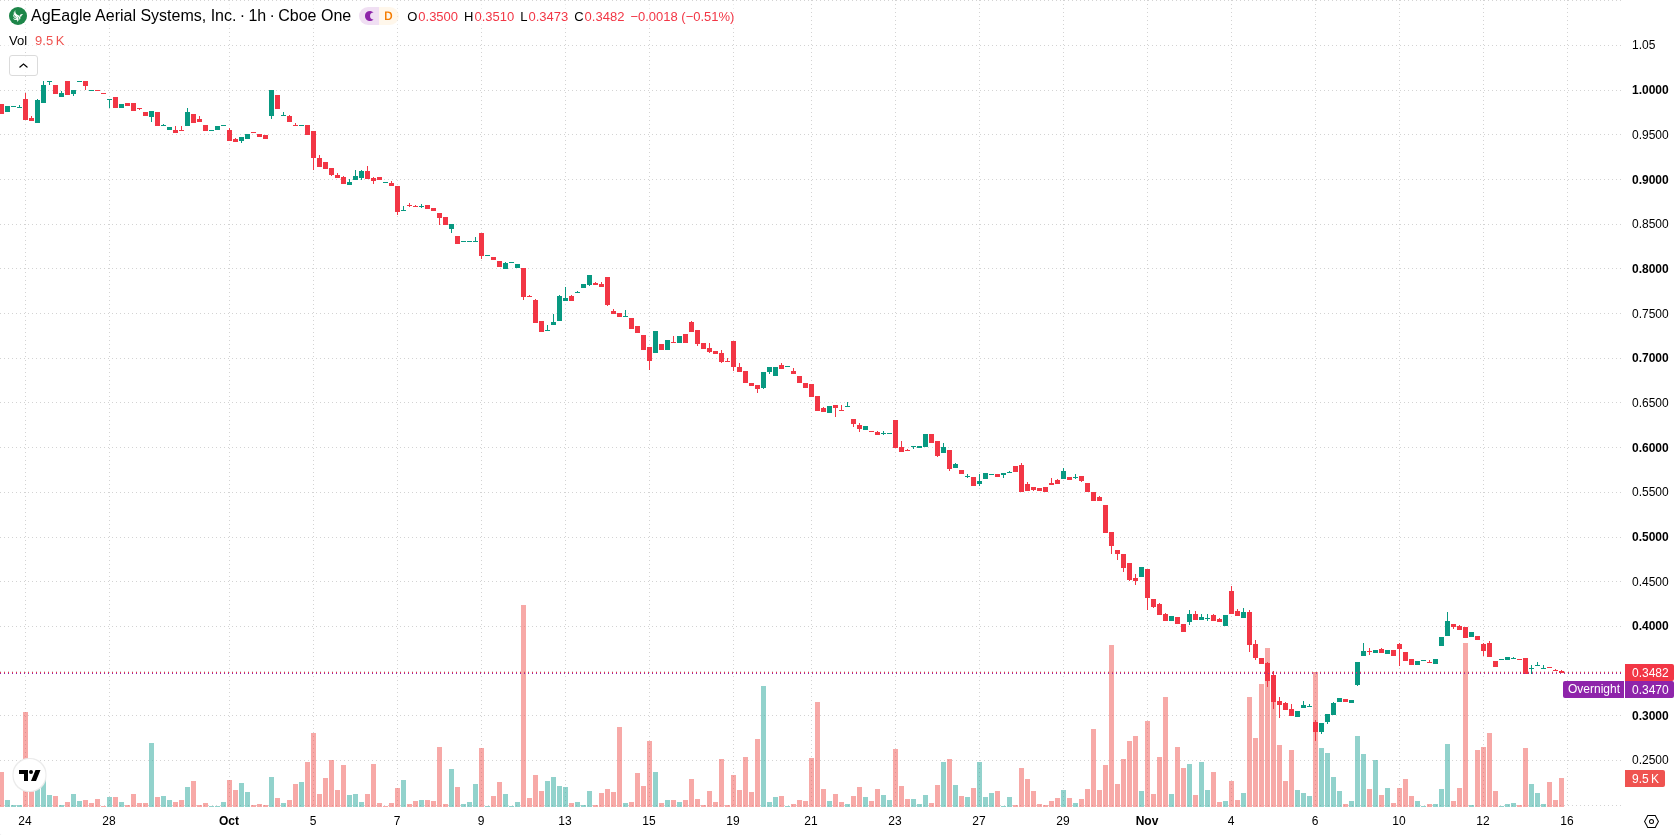
AgEagle (UAVS) stock is trading at $0.3464, down 4.44% on the day. The stock is trading below its key short- and long-term moving averages, reflecting ongoing downside momentum.
 0.3698
0.4180
Highlights
- UAVS/USD trades below key moving averages, reflecting a persistent downtrend on hourly and long-term charts.
- Intraday price dropped 4.44% to $0.34 with high volatility and no clear dominance between buyers and sellers.
- Expected short-term range is $0.31 to $0.39, with downside risk elevated and a low probability of an upside move.
Negative momentum signals as multiple indicators turn bearish
On the hourly chart, UAVS is trading below the MA-20 and MA-50, and remains well under the long-term MA-200. The daily Ichimoku Kijun level sits at $0.38, marking immediate resistance. The expected trading range for the coming days is $0.31 to $0.39. MACD is on Sell, ADX is neutral, Awesome Oscillator signals Sell, Bull/Bear Power is at zero, while RSI and CCI are neutral. Stochastic RSI is in the oversold zone, indicating potential for short-term selling exhaustion, but a rebound is not yet confirmed. Overall, momentum signals are predominately negative, though oscillators present mixed signals.
Range-bound trading likely as resistance and support levels hold
Over the short term, UAVS is likely to remain within a volatility band of $0.31 to $0.39. A breakout above the immediate resistance at $0.38 could prompt a short-lived recovery attempt, while a move below the $0.31 support may accelerate further downside. The baseline scenario points toward a continuation of range-bound trading, with a low probability of a significant upward move and a higher likelihood of renewed weakness if support fails.
Earlier, analysts noted that AgEagle's technical outlook was predominantly bearish, with ongoing downside risk and volatility. The current analysis affirms this negative bias, with traders advised to closely monitor the $0.31 support as breaching this level could signal a further extension of the downtrend.












-
 Afghanistan
-
 Albania
-
 Algeria
-
 Angola
-
 Argentina
-
 Armenia
-
 Australia
-
 Austria
-
 Azerbaijan
-
 Bahamas
-
 Bahrain
-
 Bangladesh
-
 Belarus
-
 Belgium
-
 Bolivia
-
 Botswana
-
 Brazil
-
 Brunei
-
 Bulgaria
-
 Cambodia
-
 Cameroon
-
 Canada
-
 Chile
-
 China
-
 Colombia
-
 Congo
-
 Costa Rica
-
 Cote d'Ivoire
-
 Croatia
-
 Cuba
-
 Cyprus
-
 Czechia
-
 DR Congo
-
 Denmark
-
 Dominican Republic
-
 Ecuador
-
 Egypt
-
 El Salvador
-
 Estonia
-
 Eswatini
-
 Ethiopia
-
 Finland
-
 France
-
 Georgia
-
 Germany
-
 Ghana
-
 Greece
-
 Haiti
-
 Hong Kong
-
 Hungary
-
 India
-
 Indonesia
-
 Iran, Islamic republic
-
 Iraq
-
 Ireland
-
 Israel
-
 Italy
-
 Jamaica
-
 Japan
-
 Jordan
-
 Kazakhstan
-
 Kenya
-
 Korea
-
 Kuwait
-
 Kyrgyzstan
-
 Laos
-
 Latvia
-
 Lebanon
-
 Lesotho
-
 Libya
-
 Lithuania
-
 Luxembourg
-
 Madagascar
-
 Malaysia
-
 Malta
-
 Mauritius
-
 Mexico
-
 Moldova
-
 Mongolia
-
 Montenegro
-
 Morocco
-
 Mozambique
-
 Myanmar
-
 Namibia
-
 Nepal
-
 Netherlands
-
 New Zealand
-
 Nigeria
-
 North Macedonia
-
 Norway
-
 Oman
-
 Pakistan
-
 Palestine
-
 Panama
-
 Papua New Guinea
-
 Paraguay
-
 Peru
-
 Philippines
-
 Poland
-
 Portugal
-
 Puerto Rico
-
 Qatar
-
 Reunion
-
 Romania
-
 Rwanda
-
 Saudi Arabia
-
 Serbia
-
 Singapore
-
 Slovakia
-
 Slovenia
-
 Somalia
-
 South Africa
-
 Spain
-
 Sri Lanka
-
 Sweden
-
 Switzerland
-
 Syria
-
 Taiwan
-
 Tajikistan
-
 Tanzania
-
 Thailand
-
 Trinidad and Tobago
-
 Tunisia
-
 Turkey
-
 UAE
-
 Uganda
-
 Ukraine
-
 United Kingdom
-
United States
-
 Uruguay
-
 Uzbekistan
-
 Venezuela
-
 Vietnam
-
 Yemen
-
 Zambia
-
 Zimbabwe
- Forex
- Crypto












