

Aviva general insurance premiums surge: Can AV sustain current price levels?

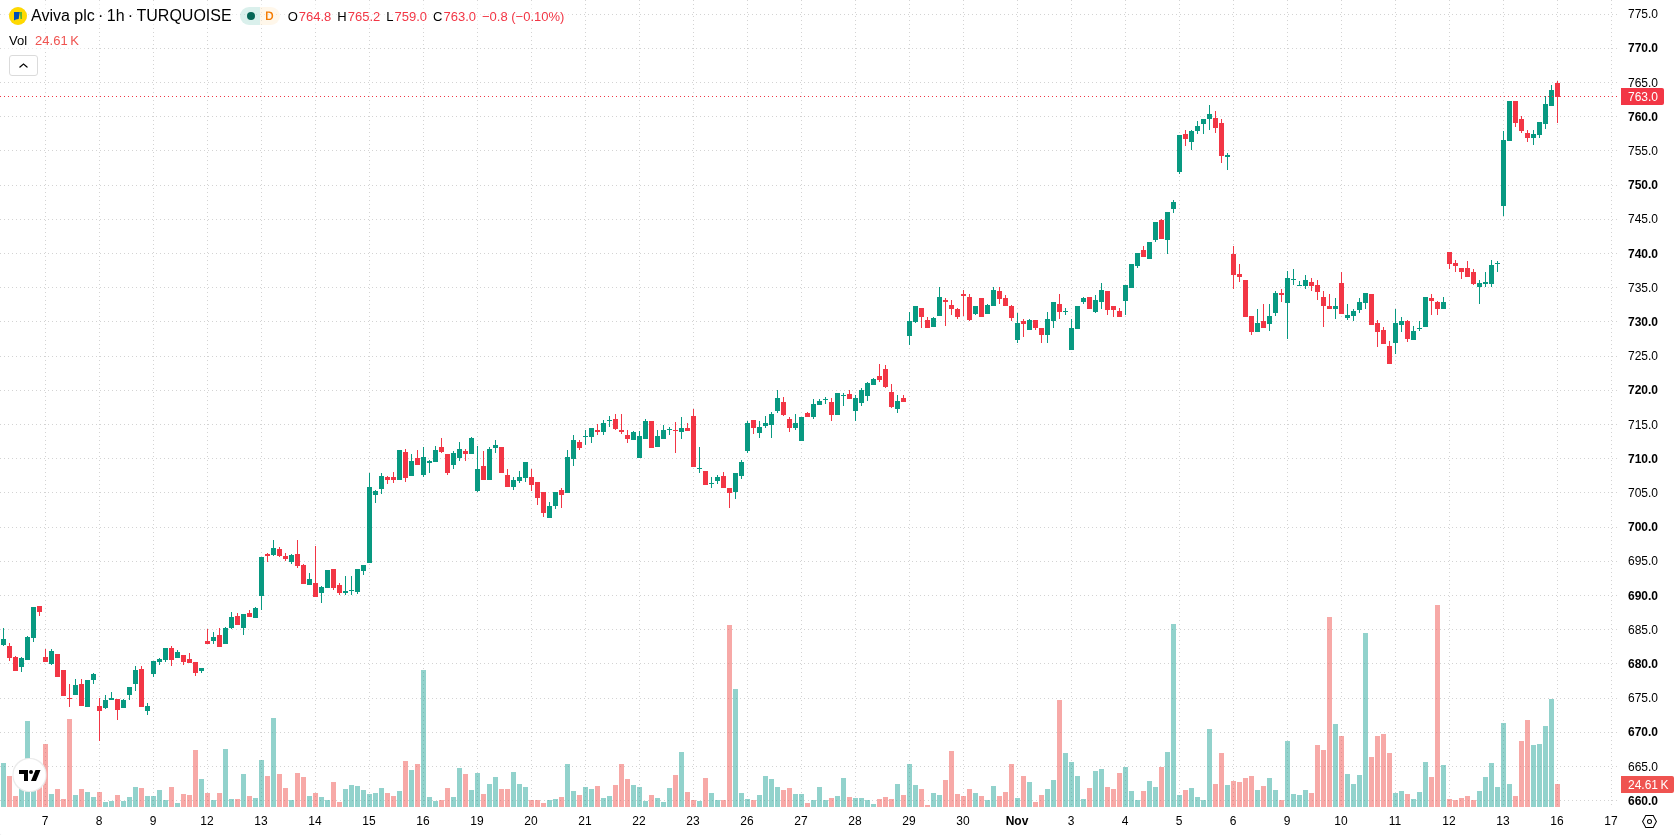
Aviva (AV) stock is trading at GBX763 after a marginal decline in today's session. The price sits above its key moving averages, reflecting a continued constructive setup across short- and long-term timeframes.
 768.20
Highlights
- Aviva's general insurance division increased premiums by 19% to £11.8bn in the first nine months of 2026.
- The combined operating ratio improved to 93.8%, supporting better underwriting efficiency and profitability.
- Shares of Aviva trade in a bullish structure with strong momentum, an expected range of GBX744.75 to GBX781.25, and low downside probability.
Insurance premium growth offsets retirement decline for mixed results
Aviva's general insurance business recorded a 19% increase in premiums to £11.8bn over the first nine months of 2026, expanding its revenue base and reflecting strength in core operations, according to TradingView. This improvement, alongside a better combined operating ratio of 93.8% in the same period, enhances underwriting efficiency and supports profitability. While retirement sales dropped 34% year-over-year to £3.5bn, the company's overall results present a balanced backdrop for its operations.
Bullish momentum builds as major supports remain intact
AV is supported immediately at the Ichimoku Kijun level of GBX746.1, with moving averages at MA-20 (GBX748.28), MA-50 (GBX738.34), and MA-200 (GBX666.24) all below the current price. Momentum remains positive, as both MACD and ADX are in buy territory. Oscillators including RSI, Stoch RSI, and CCI are neutral, indicating stable conditions without extremes. Bull/Bear Power holds at 10.43, reflecting intraday buying strength, while the Awesome Oscillator is neutral.
Range-bound trading favored as oscillators signal neutral bias
In the short term, AV is expected to consolidate within a typical volatility band between GBX744.75 and GBX781.25. The most probable scenario is sideways movement within this range, given the neutral readings from key oscillators. A sustained break above the upper resistance would open the door to further upside, while a drop below the Ichimoku Kijun support at GBX746.1 would indicate a bearish shift.
Earlier, analysts noted that Aviva demonstrated robust capital strength and persistent bullish momentum, though short-term overbought conditions pointed to the possibility of a pullback. The current article reinforces the outlook for sideways consolidation, with GBX746.1 as the key support level to monitor for signs of a shift in the prevailing range-bound trend.








-
 Afghanistan
-
 Albania
-
 Algeria
-
 Angola
-
 Argentina
-
 Armenia
-
 Australia
-
 Austria
-
 Azerbaijan
-
 Bahamas
-
 Bahrain
-
 Bangladesh
-
 Belarus
-
 Belgium
-
 Bolivia
-
 Botswana
-
 Brazil
-
 Brunei
-
 Bulgaria
-
 Cambodia
-
 Cameroon
-
 Canada
-
 Chile
-
 China
-
 Colombia
-
 Congo
-
 Costa Rica
-
 Cote d'Ivoire
-
 Croatia
-
 Cuba
-
 Cyprus
-
 Czechia
-
 DR Congo
-
 Denmark
-
 Dominican Republic
-
 Ecuador
-
 Egypt
-
 El Salvador
-
 Estonia
-
 Eswatini
-
 Ethiopia
-
 Finland
-
 France
-
 Georgia
-
 Germany
-
 Ghana
-
 Greece
-
 Haiti
-
 Hong Kong
-
 Hungary
-
 India
-
 Indonesia
-
 Iran, Islamic republic
-
 Iraq
-
 Ireland
-
 Israel
-
 Italy
-
 Jamaica
-
 Japan
-
 Jordan
-
 Kazakhstan
-
 Kenya
-
 Korea
-
 Kuwait
-
 Kyrgyzstan
-
 Laos
-
 Latvia
-
 Lebanon
-
 Lesotho
-
 Libya
-
 Lithuania
-
 Luxembourg
-
 Madagascar
-
 Malaysia
-
 Malta
-
 Mauritius
-
 Mexico
-
 Moldova
-
 Mongolia
-
 Montenegro
-
 Morocco
-
 Mozambique
-
 Myanmar
-
 Namibia
-
 Nepal
-
 Netherlands
-
 New Zealand
-
 Nigeria
-
 North Macedonia
-
 Norway
-
 Oman
-
 Pakistan
-
 Palestine
-
 Panama
-
 Papua New Guinea
-
 Paraguay
-
 Peru
-
 Philippines
-
 Poland
-
 Portugal
-
 Puerto Rico
-
 Qatar
-
 Reunion
-
 Romania
-
 Rwanda
-
 Saudi Arabia
-
 Serbia
-
 Singapore
-
 Slovakia
-
 Slovenia
-
 Somalia
-
 South Africa
-
 Spain
-
 Sri Lanka
-
 Sweden
-
 Switzerland
-
 Syria
-
 Taiwan
-
 Tajikistan
-
 Tanzania
-
 Thailand
-
 Trinidad and Tobago
-
 Tunisia
-
 Turkey
-
 UAE
-
 Uganda
-
 Ukraine
-
 United Kingdom
-
United States
-
 Uruguay
-
 Uzbekistan
-
 Venezuela
-
 Vietnam
-
 Yemen
-
 Zambia
-
 Zimbabwe
- Forex
- Crypto












