

NVDA drops as seller pressure intensifies in high volatility trading

Nvidia (NVDA) stock is trading at $162.10, down 2.51% on the day and remaining below its key moving averages. The stock continues to face sustained selling pressure relative to recent trend benchmarks.
 166.45
177.53
Highlights
- Nvidia faces a 10-day deadline from the US Treasury to respond to alleged export-control violations regarding AI chip shipments to China.
- The company is under ongoing US Department of Justice and antitrust investigations, with key leadership uncertainty ahead of its next earnings call.
- Shares of Nvidia trade below key moving averages with strong selling momentum, a high probability of further declines, and a projected range of $149.96 to $174.24.
Regulatory actions and weak ETF flows heighten legal uncertainty
Nvidia faces increased regulatory pressure after US Treasury Secretary Scott Bessent issued a formal 10-day deadline on November 15, 2026, for its board to address alleged export-control violations concerning potential AI chip shipments to China, a move that could trigger a broader review of its compliance practices, according to Cryptonews. The company has also come under multiple ongoing US Department of Justice investigations, including antitrust scrutiny, with former CEO Jensen Huang set to testify before the US Senate, further clouding the company’s legal outlook as reported by Yahoo Finance. In parallel, institutional demand has weakened with ETFs recording $287.5 million in net outflows from Nvidia shares on November 12, 2026—led by the SPDR S&P 500 ETF—while the upcoming earnings call with interim CEO Colette Kress introduces further uncertainty around near-term leadership and strategic direction.
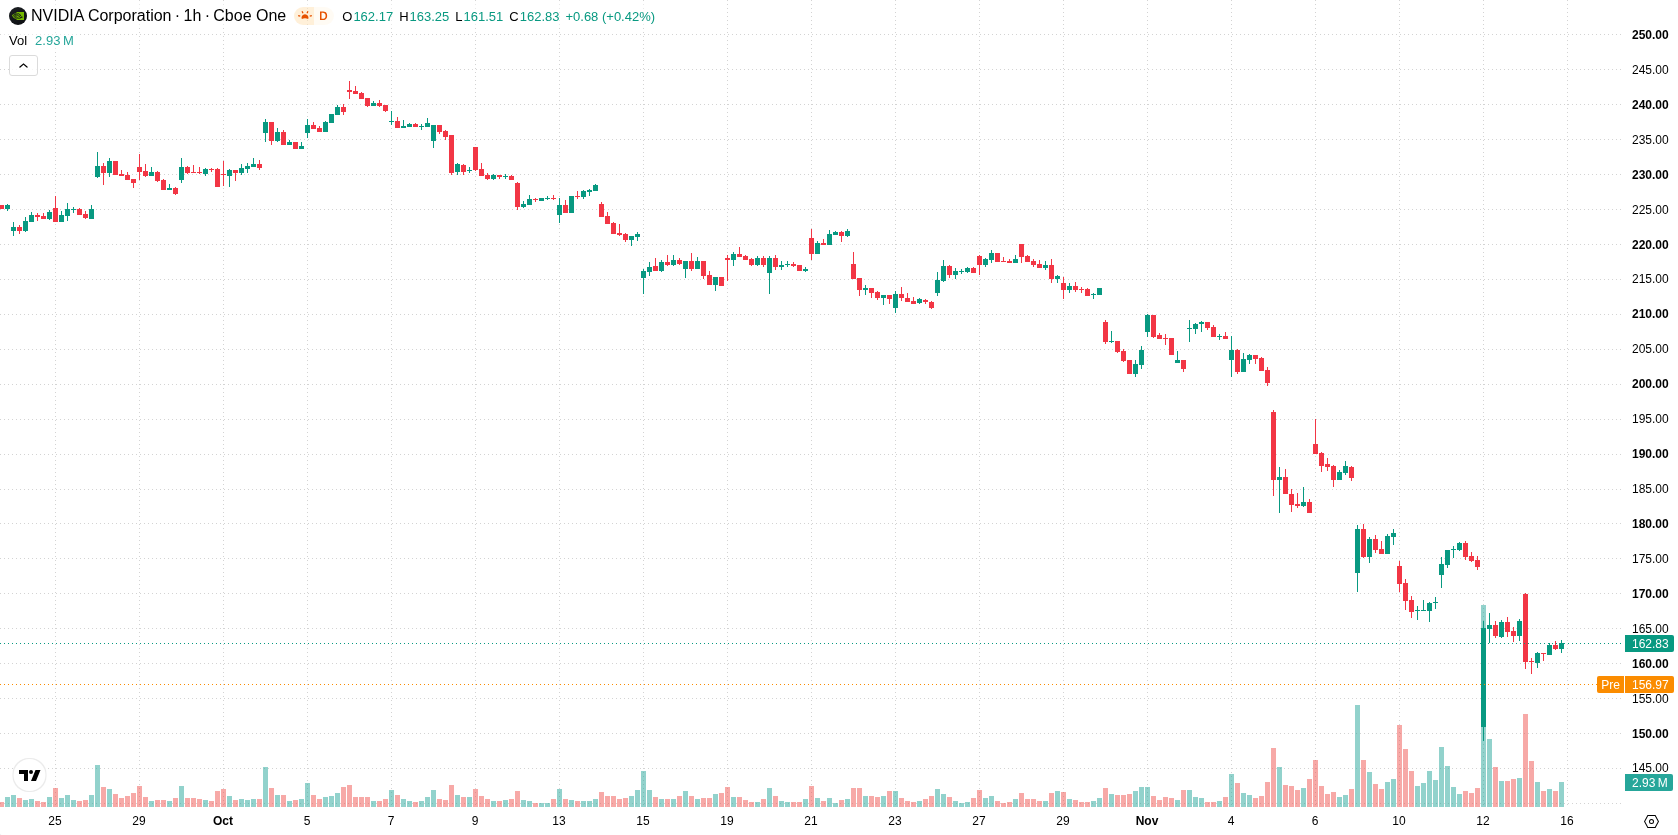
Negative momentum and volatility as price remains below resistance
Technically, NVDA/USD is trading below the MA-20 ($165.54) and MA-50 ($172.97) on the hourly chart, as well as under the long-term MA-200 ($204.19). The immediate resistance is set by the Ichimoku Kijun at $163.17. Momentum remains predominantly negative, with MACD signaling Strong Sell and ADX on Sell. All three oscillators—RSI, Stoch RSI, and CCI—are neutral, while Bull/Bear Power at -1.54 underlines continued intraday selling. The Awesome Oscillator is neutral, and current price action features high volatility, a slight opening gap of 0.13, and mid-range positioning, in line with the prevailing seller dominance.
Elevated downside risk as upside breakout prospects dim
In the short term, NVDA is expected to fluctuate within a range of $149.96 to $174.24. Probability of upside moves is very low, while downside risk remains elevated, suggesting further declines are the likeliest outcome. The baseline scenario projects ongoing consolidation within this band, with a bullish reversal only possible if resistance is clearly surpassed, and a bearish continuation anticipated if support at the lower end is breached.
Earlier, analysts noted that Nvidia’s stock was under pressure amid significant leadership changes and scrutiny over its future direction. With fresh regulatory and legal headwinds now compounding technical weakness, close attention should be paid to the $149.96–$174.24 range, as a break of support could accelerate further downside risk.






Latest NVIDIA News





-
 Afghanistan
-
 Albania
-
 Algeria
-
 Angola
-
 Argentina
-
 Armenia
-
 Australia
-
 Austria
-
 Azerbaijan
-
 Bahamas
-
 Bahrain
-
 Bangladesh
-
 Belarus
-
 Belgium
-
 Bolivia
-
 Botswana
-
 Brazil
-
 Brunei
-
 Bulgaria
-
 Cambodia
-
 Cameroon
-
 Canada
-
 Chile
-
 China
-
 Colombia
-
 Congo
-
 Costa Rica
-
 Cote d'Ivoire
-
 Croatia
-
 Cuba
-
 Cyprus
-
 Czechia
-
 DR Congo
-
 Denmark
-
 Dominican Republic
-
 Ecuador
-
 Egypt
-
 El Salvador
-
 Estonia
-
 Eswatini
-
 Ethiopia
-
 Finland
-
 France
-
 Georgia
-
 Germany
-
 Ghana
-
 Greece
-
 Haiti
-
 Hong Kong
-
 Hungary
-
 India
-
 Indonesia
-
 Iran, Islamic republic
-
 Iraq
-
 Ireland
-
 Israel
-
 Italy
-
 Jamaica
-
 Japan
-
 Jordan
-
 Kazakhstan
-
 Kenya
-
 Korea
-
 Kuwait
-
 Kyrgyzstan
-
 Laos
-
 Latvia
-
 Lebanon
-
 Lesotho
-
 Libya
-
 Lithuania
-
 Luxembourg
-
 Madagascar
-
 Malaysia
-
 Malta
-
 Mauritius
-
 Mexico
-
 Moldova
-
 Mongolia
-
 Montenegro
-
 Morocco
-
 Mozambique
-
 Myanmar
-
 Namibia
-
 Nepal
-
 Netherlands
-
 New Zealand
-
 Nigeria
-
 North Macedonia
-
 Norway
-
 Oman
-
 Pakistan
-
 Palestine
-
 Panama
-
 Papua New Guinea
-
 Paraguay
-
 Peru
-
 Philippines
-
 Poland
-
 Portugal
-
 Puerto Rico
-
 Qatar
-
 Reunion
-
 Romania
-
 Rwanda
-
 Saudi Arabia
-
 Serbia
-
 Singapore
-
 Slovakia
-
 Slovenia
-
 Somalia
-
 South Africa
-
 Spain
-
 Sri Lanka
-
 Sweden
-
 Switzerland
-
 Syria
-
 Taiwan
-
 Tajikistan
-
 Tanzania
-
 Thailand
-
 Trinidad and Tobago
-
 Tunisia
-
 Turkey
-
 UAE
-
 Uganda
-
 Ukraine
-
 United Kingdom
-
United States
-
 Uruguay
-
 Uzbekistan
-
 Venezuela
-
 Vietnam
-
 Yemen
-
 Zambia
-
 Zimbabwe
- Forex
- Crypto












