

S&P 500 index slides as sellers maintain modest intraday advantage

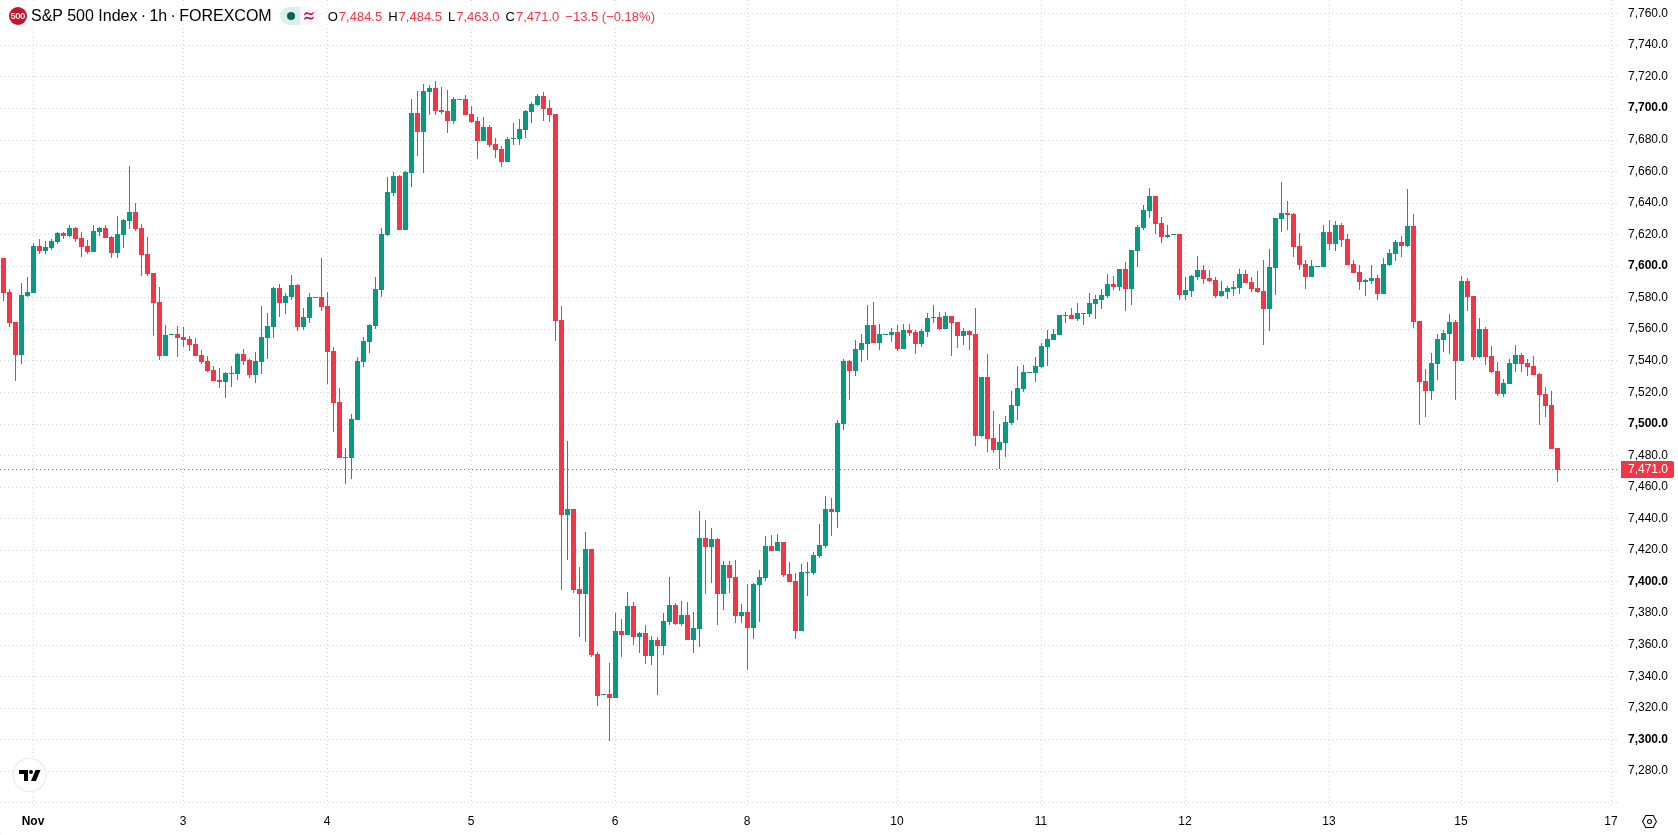
S&P 500 (SPX) is trading at 7,466, down 1.25% on the day. The index sits below its key short- and medium-term moving averages, but remains above longer-term trend levels.
 7617.27
7649.65
Highlights
- The S&P 500 rallied 3% last week to close above 7,514, putting the index 10% over last year’s level.
- Renewed selling has pushed the S&P 500 down 1.25% during the current session, with price action moving under pressure.
- Technical indicators show the index trades below short- and medium-term moving averages with neutral momentum, and the expected range for the next 2 to 3 days is 7,426 to 7,519 points, with a high probability of further declines.
Prior rally fades as renewed selling pressures shape sentiment
The S&P 500 recorded a 3% rally last week, rebounding from the lower boundary of its previous trading range and closing above 7,514, a level that stands 10% higher than last year's finish, according to Schaeffer's Investment Research. This sizeable weekly gain points to a phase of positive momentum, likely shaping trader positioning in the early part of the week. However, this prior strength has given way to renewed selling as the current session progresses, with price action coming under pressure.
Bearish bias persists as SPX holds below key moving averages
Technically, SPX is trading below both its MA-20 and MA-50 on the h1 chart, reflecting short- and medium-term bearish pressure, while it remains supported by the longer-term MA-200. Immediate resistance is identified at the Ichimoku Kijun level of 7,576. Momentum readings are neutral across RSI, Stoch RSI, CCI, MACD, and ADX, highlighting a lack of directional conviction. Intraday action is marked by modest seller advantage, as indicated by Bull/Bear Power at -3.17.
Downside risk elevated as rebound odds diminish in narrow range
Over the next 2–3 trading days, SPX is expected to remain within a typical volatility band of 7,426 to 7,519. The probability of a significant rebound is low, with a high likelihood of continued declines if the index slips below 7,426. Alternatively, a decisive move above 7,576 could signal a bullish breakout, but the baseline scenario favors sideways or modest downside movement within the stated range.
Earlier, analysts noted that the longer-term outlook for the S&P 500 remained constructive despite periods of volatility and short-term corrections. With the current price action showing indecision beneath key medium-term resistance levels, traders should watch for a confirmed break above 7,576 or a drop below 7,426 as signals for the next significant directional move.






Latest S&P 500 News





-
 Afghanistan
-
 Albania
-
 Algeria
-
 Angola
-
 Argentina
-
 Armenia
-
 Australia
-
 Austria
-
 Azerbaijan
-
 Bahamas
-
 Bahrain
-
 Bangladesh
-
 Belarus
-
 Belgium
-
 Bolivia
-
 Botswana
-
 Brazil
-
 Brunei
-
 Bulgaria
-
 Cambodia
-
 Cameroon
-
 Canada
-
 Chile
-
 China
-
 Colombia
-
 Congo
-
 Costa Rica
-
 Cote d'Ivoire
-
 Croatia
-
 Cuba
-
 Cyprus
-
 Czechia
-
 DR Congo
-
 Denmark
-
 Dominican Republic
-
 Ecuador
-
 Egypt
-
 El Salvador
-
 Estonia
-
 Eswatini
-
 Ethiopia
-
 Finland
-
 France
-
 Georgia
-
 Germany
-
 Ghana
-
 Greece
-
 Haiti
-
 Hong Kong
-
 Hungary
-
 India
-
 Indonesia
-
 Iran, Islamic republic
-
 Iraq
-
 Ireland
-
 Israel
-
 Italy
-
 Jamaica
-
 Japan
-
 Jordan
-
 Kazakhstan
-
 Kenya
-
 Korea
-
 Kuwait
-
 Kyrgyzstan
-
 Laos
-
 Latvia
-
 Lebanon
-
 Lesotho
-
 Libya
-
 Lithuania
-
 Luxembourg
-
 Madagascar
-
 Malaysia
-
 Malta
-
 Mauritius
-
 Mexico
-
 Moldova
-
 Mongolia
-
 Montenegro
-
 Morocco
-
 Mozambique
-
 Myanmar
-
 Namibia
-
 Nepal
-
 Netherlands
-
 New Zealand
-
 Nigeria
-
 North Macedonia
-
 Norway
-
 Oman
-
 Pakistan
-
 Palestine
-
 Panama
-
 Papua New Guinea
-
 Paraguay
-
 Peru
-
 Philippines
-
 Poland
-
 Portugal
-
 Puerto Rico
-
 Qatar
-
 Reunion
-
 Romania
-
 Rwanda
-
 Saudi Arabia
-
 Serbia
-
 Singapore
-
 Slovakia
-
 Slovenia
-
 Somalia
-
 South Africa
-
 Spain
-
 Sri Lanka
-
 Sweden
-
 Switzerland
-
 Syria
-
 Taiwan
-
 Tajikistan
-
 Tanzania
-
 Thailand
-
 Trinidad and Tobago
-
 Tunisia
-
 Turkey
-
 UAE
-
 Uganda
-
 Ukraine
-
 United Kingdom
-
United States
-
 Uruguay
-
 Uzbekistan
-
 Venezuela
-
 Vietnam
-
 Yemen
-
 Zambia
-
 Zimbabwe
- Forex
- Crypto












