

Can a larger net loss pressure Riot Platforms stock?

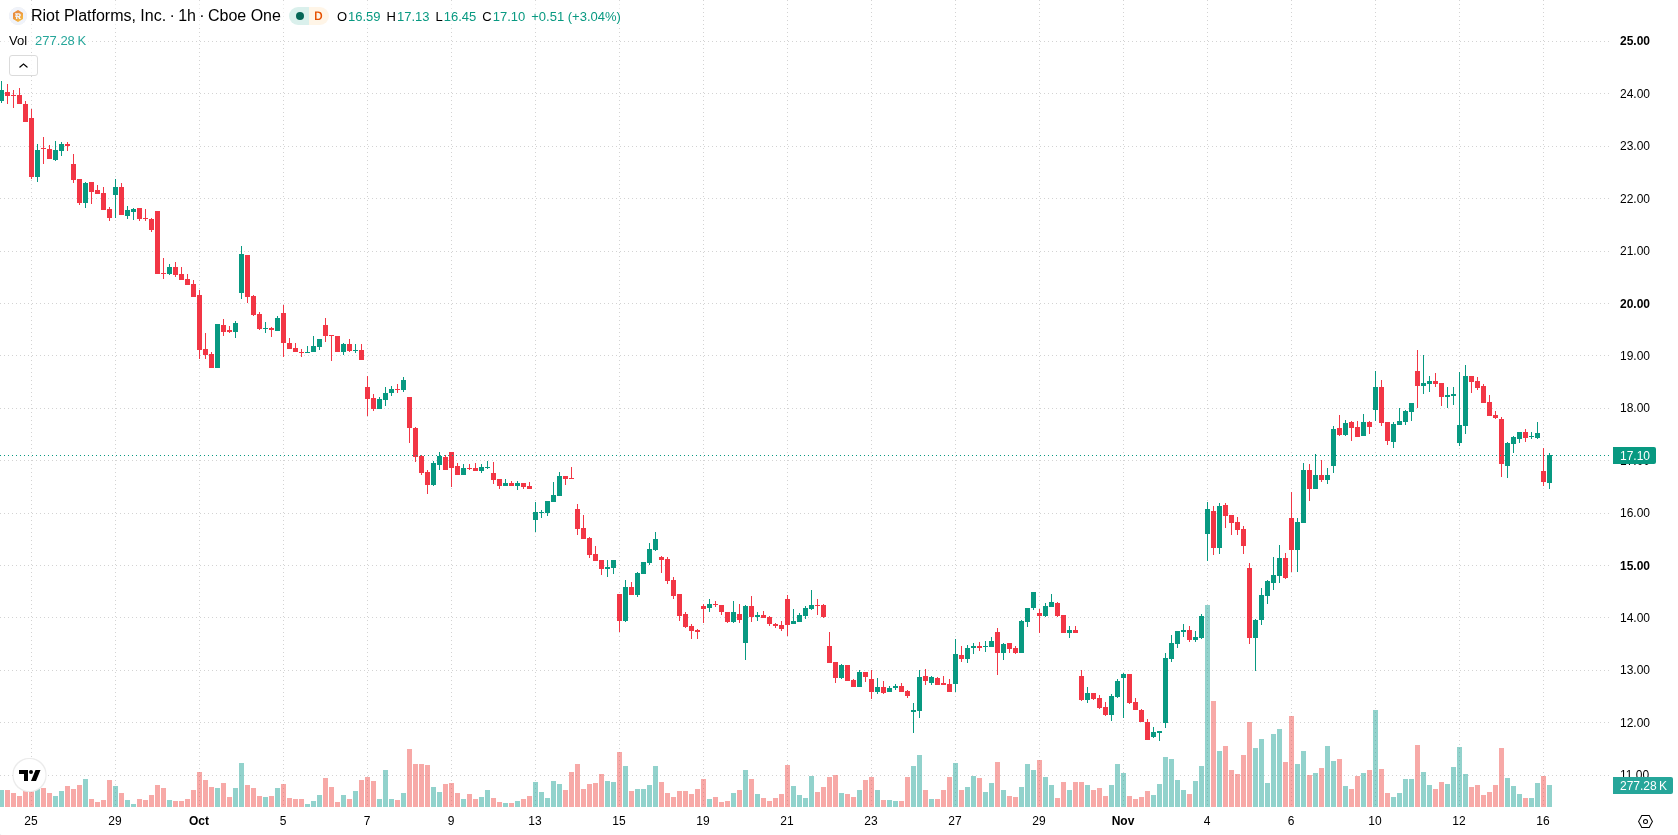
Riot Platforms (RIOT) stock is trading at $16.96, posting a drop of 2.83% on the day. The price sits below its key short, medium, and long-term moving averages, which reflects ongoing downside momentum.
 17.66
18.96
Highlights
- Riot Platforms reported a net loss of $733.6 million in the first nine months of 2026 due to depreciation, Bitcoin fair-value losses, non-cash items, and higher operating expenses.
- This loss raises concerns about the sustainability of Riot Platforms business model amid ongoing exposure to Bitcoin price volatility and operational costs.
- Shares of Riot Platforms trade below key moving averages with strong seller control, an expected price range of $15.96 to $18.06, and a bearish bias prevailing over the next several days.
Large net loss fuels risk-off tone amid bitcoin volatility
Riot Platforms reported a net loss of $733.6 million for the first nine months of 2026, reflecting the impact of depreciation, Bitcoin fair-value losses, other non-cash items, and higher operating expenses. This substantial loss highlights the company's ongoing exposure to both operational costs and the volatility of Bitcoin's value, raising concerns about the sustainability of its business model. The scale of the reported loss has weighed on investor sentiment and contributed to the current risk-off tone surrounding the stock.
Short-term selling pressure as oversold signals limit reversal scope
On the technical front, RIOT/USD trades below H1 SMA-20 at $17.85, H1 SMA-50 at $17.16, and D1 SMA-200 at $19.35. The Ichimoku Kijun at $17.81 presents the nearest resistance. Momentum readings indicate a neutral MACD, with ADX signaling a sell. RSI remains neutral, while both Stoch RSI and CCI are in their oversold zones, pointing to potential selling exhaustion rather than a confirmed reversal. Bull/Bear Power holds negative at -0.31, underlining intraday seller dominance, while the Awesome Oscillator is neutral, contributing to a mix of momentum signals.
Further declines favored absent momentum shift or resistance break
Over the next few trading days, RIOT is expected to fluctuate within a typical volatility band of $15.96 to $18.06. The probability of an upward move stands near 35%, indicating a greater risk of further declines absent a clear change in momentum. Base case calls for continued consolidation unless immediate resistance is breached, while a breakdown below $15.96 would likely result in further downside.
Earlier, analysts noted that Riot Platforms has shifted its focus from accumulating Bitcoin to selling most of its mined coins and investing in large-scale AI infrastructure projects, signaling a fundamental transition in its business strategy. The current technical and fundamental pressures on RIOT's stock reinforce the underlying strategic uncertainties, and traders should monitor the $15.96 level as a critical support, with a sustained break below it posing heightened downside risk in the near term.






Latest Riot News





-
 Afghanistan
-
 Albania
-
 Algeria
-
 Angola
-
 Argentina
-
 Armenia
-
 Australia
-
 Austria
-
 Azerbaijan
-
 Bahamas
-
 Bahrain
-
 Bangladesh
-
 Belarus
-
 Belgium
-
 Bolivia
-
 Botswana
-
 Brazil
-
 Brunei
-
 Bulgaria
-
 Cambodia
-
 Cameroon
-
 Canada
-
 Chile
-
 China
-
 Colombia
-
 Congo
-
 Costa Rica
-
 Cote d'Ivoire
-
 Croatia
-
 Cuba
-
 Cyprus
-
 Czechia
-
 DR Congo
-
 Denmark
-
 Dominican Republic
-
 Ecuador
-
 Egypt
-
 El Salvador
-
 Estonia
-
 Eswatini
-
 Ethiopia
-
 Finland
-
 France
-
 Georgia
-
 Germany
-
 Ghana
-
 Greece
-
 Haiti
-
 Hong Kong
-
 Hungary
-
 India
-
 Indonesia
-
 Iran, Islamic republic
-
 Iraq
-
 Ireland
-
 Israel
-
 Italy
-
 Jamaica
-
 Japan
-
 Jordan
-
 Kazakhstan
-
 Kenya
-
 Korea
-
 Kuwait
-
 Kyrgyzstan
-
 Laos
-
 Latvia
-
 Lebanon
-
 Lesotho
-
 Libya
-
 Lithuania
-
 Luxembourg
-
 Madagascar
-
 Malaysia
-
 Malta
-
 Mauritius
-
 Mexico
-
 Moldova
-
 Mongolia
-
 Montenegro
-
 Morocco
-
 Mozambique
-
 Myanmar
-
 Namibia
-
 Nepal
-
 Netherlands
-
 New Zealand
-
 Nigeria
-
 North Macedonia
-
 Norway
-
 Oman
-
 Pakistan
-
 Palestine
-
 Panama
-
 Papua New Guinea
-
 Paraguay
-
 Peru
-
 Philippines
-
 Poland
-
 Portugal
-
 Puerto Rico
-
 Qatar
-
 Reunion
-
 Romania
-
 Rwanda
-
 Saudi Arabia
-
 Serbia
-
 Singapore
-
 Slovakia
-
 Slovenia
-
 Somalia
-
 South Africa
-
 Spain
-
 Sri Lanka
-
 Sweden
-
 Switzerland
-
 Syria
-
 Taiwan
-
 Tajikistan
-
 Tanzania
-
 Thailand
-
 Trinidad and Tobago
-
 Tunisia
-
 Turkey
-
 UAE
-
 Uganda
-
 Ukraine
-
 United Kingdom
-
United States
-
 Uruguay
-
 Uzbekistan
-
 Venezuela
-
 Vietnam
-
 Yemen
-
 Zambia
-
 Zimbabwe
- Forex
- Crypto












