

Core Scientific shares technical analysis: Oversold conditions emerge as price nears $13.12 support

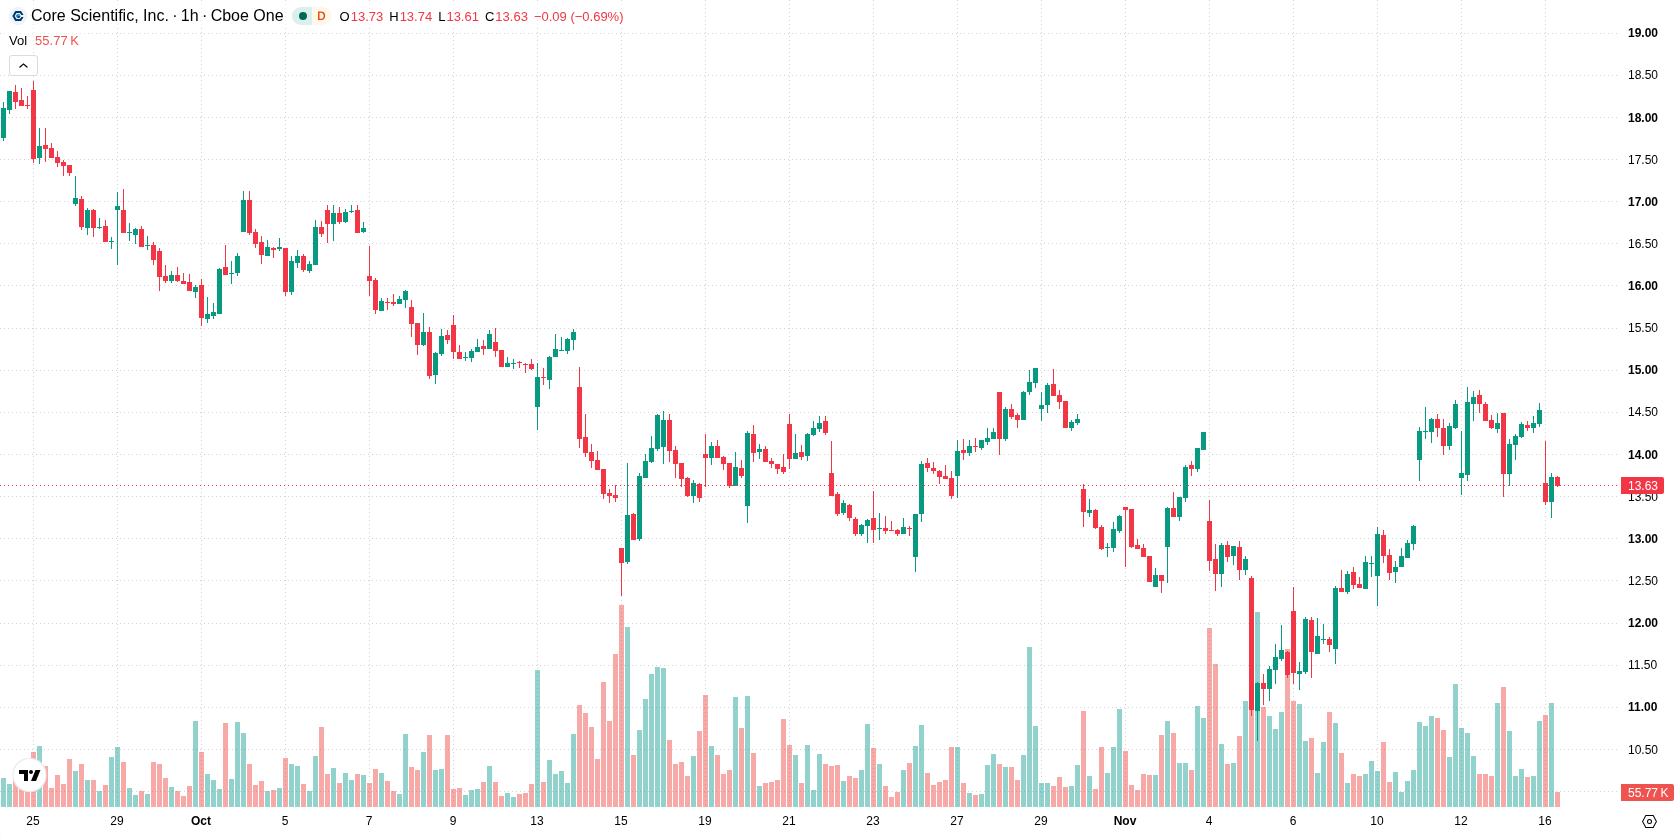
Core Scientific Inc. (CORZ) stock is trading at $13.62, down 6.04% for the day. The price currently sits below its key short-term averages and remains well beneath longer-term averages, reflecting notable intraday volatility and relative weakness in the near term.
 14.16
14.78
Highlights
- Core Scientific management projects a surge in demand for AI colocation services, indicating expected growth in infrastructure and hosting revenue.
- Industry trends favor accelerated adoption of AI workloads, supporting management's positive outlook for future business expansion.
- Shares of Core Scientific fell 6.04% to $13.62 with mixed momentum signals and are forecast to consolidate in a $12.48 to $14.76 range.
AI demand optimism contrasted by ongoing selling pressure
Core Scientific Inc. recently held its Q3 earnings call, during which management highlighted a strong positive outlook concerning demand for AI colocation services, according to Tipranks. This development signals anticipated growth in the firm's infrastructure and hosting business, reflecting industry trends toward accelerated adoption of AI workloads. While this update suggests favorable prospects for the company's future revenue streams, price action has remained under broader selling pressure.
Mixed momentum as support holds but oversold signals intensify
On the technical front, CORZ/USD is positioned below H1 SMA-20 at $14.23 but remains above H1 SMA-50 at $13.12, establishing $14.23 as near-term resistance and $13.12 as medium-term support. The price continues to trade well beneath D1 SMA-200 at $19.37, while the Ichimoku Kijun at $13.74 marks immediate overhead resistance. Technical indicators present mixed readings: MACD signals a strong buy, but ADX indicates a sell. RSI remains neutral, with the Stoch RSI and CCI both deep in oversold territory, hinting at potential selling exhaustion. Bull/Bear Power stands at -0.56, highlighting intraday seller dominance, while the Awesome Oscillator is neutral.
Rangebound outlook as volatility persists amid downside bias
Looking ahead, the forecast scenario anticipates CORZ/USD consolidating within a volatile range of $12.48 to $14.76 over the coming sessions. Upside attempts will require a breakout above immediate resistance at $14.23 and the Ichimoku Kijun at $13.74, with the probability of an upswing estimated at 48%. Downside moves remain slightly more likely at 52%, with further weakness possibly testing the $12.48 support area. Overall, price action is expected to remain within this typical volatility band absent a decisive break from the current range.
Earlier, analysts noted that Core Scientific was exhibiting cautious bullish momentum as price action consolidated above key support levels, awaiting a decisive breakout. The current analysis adds a new dimension with mixed technical signals and management's positive AI outlook, while immediate attention should focus on $14.23 and $13.74 as resistance thresholds that could define the next directional move.






Latest Core Scientific News




-
 Afghanistan
-
 Albania
-
 Algeria
-
 Angola
-
 Argentina
-
 Armenia
-
 Australia
-
 Austria
-
 Azerbaijan
-
 Bahamas
-
 Bahrain
-
 Bangladesh
-
 Belarus
-
 Belgium
-
 Bolivia
-
 Botswana
-
 Brazil
-
 Brunei
-
 Bulgaria
-
 Cambodia
-
 Cameroon
-
 Canada
-
 Chile
-
 China
-
 Colombia
-
 Congo
-
 Costa Rica
-
 Cote d'Ivoire
-
 Croatia
-
 Cuba
-
 Cyprus
-
 Czechia
-
 DR Congo
-
 Denmark
-
 Dominican Republic
-
 Ecuador
-
 Egypt
-
 El Salvador
-
 Estonia
-
 Eswatini
-
 Ethiopia
-
 Finland
-
 France
-
 Georgia
-
 Germany
-
 Ghana
-
 Greece
-
 Haiti
-
 Hong Kong
-
 Hungary
-
 India
-
 Indonesia
-
 Iran, Islamic republic
-
 Iraq
-
 Ireland
-
 Israel
-
 Italy
-
 Jamaica
-
 Japan
-
 Jordan
-
 Kazakhstan
-
 Kenya
-
 Korea
-
 Kuwait
-
 Kyrgyzstan
-
 Laos
-
 Latvia
-
 Lebanon
-
 Lesotho
-
 Libya
-
 Lithuania
-
 Luxembourg
-
 Madagascar
-
 Malaysia
-
 Malta
-
 Mauritius
-
 Mexico
-
 Moldova
-
 Mongolia
-
 Montenegro
-
 Morocco
-
 Mozambique
-
 Myanmar
-
 Namibia
-
 Nepal
-
 Netherlands
-
 New Zealand
-
 Nigeria
-
 North Macedonia
-
 Norway
-
 Oman
-
 Pakistan
-
 Palestine
-
 Panama
-
 Papua New Guinea
-
 Paraguay
-
 Peru
-
 Philippines
-
 Poland
-
 Portugal
-
 Puerto Rico
-
 Qatar
-
 Reunion
-
 Romania
-
 Rwanda
-
 Saudi Arabia
-
 Serbia
-
 Singapore
-
 Slovakia
-
 Slovenia
-
 Somalia
-
 South Africa
-
 Spain
-
 Sri Lanka
-
 Sweden
-
 Switzerland
-
 Syria
-
 Taiwan
-
 Tajikistan
-
 Tanzania
-
 Thailand
-
 Trinidad and Tobago
-
 Tunisia
-
 Turkey
-
 UAE
-
 Uganda
-
 Ukraine
-
 United Kingdom
-
United States
-
 Uruguay
-
 Uzbekistan
-
 Venezuela
-
 Vietnam
-
 Yemen
-
 Zambia
-
 Zimbabwe
- Forex
- Crypto












