

Restructuring charges weigh on The Trade Desk stock amid increased selling pressure

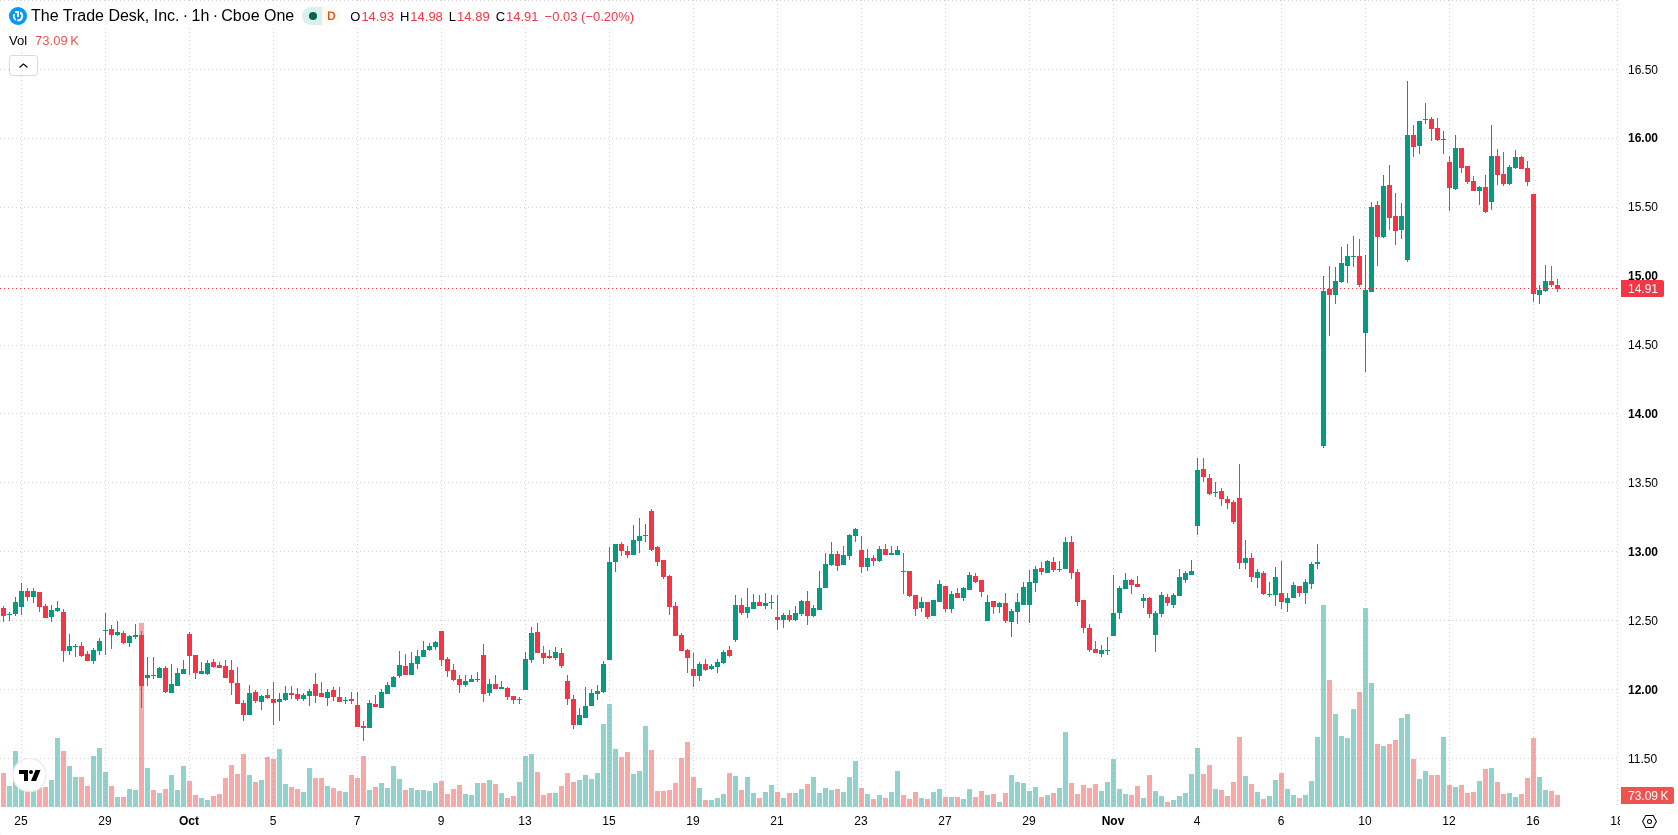
The Trade Desk (TTD) stock is trading at $14.96 after a daily decline of 4.49%. The price sits below its key short-term moving averages, reflecting increased downward momentum relative to recent trading levels.
 15.59
16.40
Highlights
- The Trade Desk reported third-quarter revenue of $736 million with adjusted EPS of $0.33 and adjusted EBITDA of $266 million, exceeding its prior guidance and analyst consensus.
- The company increased its share repurchase authorization by $731 million to a total of $1 billion and recorded $44 million in restructuring charges linked mainly to severance and employee benefits.
- Shares of The Trade Desk closed at $14.96, falling 4.49% amid selling pressure, with technical indicators mixed and expected trading range of $14.03 to $15.89 in the coming days.
Buybacks expanded and restructuring costs emerge amid mixed results
The Trade Desk reported flat third-quarter revenue of $736 million, surpassing analyst consensus and its prior guidance, with adjusted EPS of $0.33 and adjusted EBITDA of $266 million. The company expanded its buyback authorization by $731 million, increasing available capacity for share repurchases to $1 billion, according to Tipranks; this move is typically used to help stabilize price during periods of volatility. Additionally, The Trade Desk incurred $44 million in restructuring charges in the third quarter, primarily related to severance and employee benefits, as also reported by Tipranks, raising questions about the pace of operational adjustments amid mixed market conditions.
Intraday technical boundaries challenged as momentum signals remain conflicted
Technically, TTD is positioned below the H1 SMA-20 at $15.77 and above the H1 SMA-50 at $14.78, while remaining well below the D1 SMA-200 at $19.06. The Ichimoku Kijun at $15.62 acts as immediate resistance. MACD is displaying strong buy momentum, while ADX indicates a selling environment with mixed momentum signals overall. RSI sits in the neutral zone, whereas both Stochastic RSI and CCI are in oversold territory, implying potential for a rebound but not confirming an imminent reversal. Bull/Bear Power is marginally negative, suggesting slight seller dominance on an intraday basis.
Recovery odds edge higher as price consolidates in volatility band
Over the next several days, the price is expected to trade within a volatility band between $14.03 and $15.89. The probability of an upward move is 55%, making a retracement higher slightly more likely than a renewed downturn at 45%. The baseline scenario is consolidation within this range. A break above the $15.62 resistance would support a short-term recovery, while a fall below the $14.03 support level could trigger further downside momentum.
Previously it was reported that The Trade Desk’s technical and operational improvements had positioned the stock for potential gains despite ongoing volatility risks. The latest combination of flat quarterly revenue, expanded buyback capacity, and restructuring charges introduces a mixed operational outlook, highlighting $15.62 as a pivotal resistance level for any short-term rebound scenarios.






Latest The Trade Desk News


-
 Afghanistan
-
 Albania
-
 Algeria
-
 Angola
-
 Argentina
-
 Armenia
-
 Australia
-
 Austria
-
 Azerbaijan
-
 Bahamas
-
 Bahrain
-
 Bangladesh
-
 Belarus
-
 Belgium
-
 Bolivia
-
 Botswana
-
 Brazil
-
 Brunei
-
 Bulgaria
-
 Cambodia
-
 Cameroon
-
 Canada
-
 Chile
-
 China
-
 Colombia
-
 Congo
-
 Costa Rica
-
 Cote d'Ivoire
-
 Croatia
-
 Cuba
-
 Cyprus
-
 Czechia
-
 DR Congo
-
 Denmark
-
 Dominican Republic
-
 Ecuador
-
 Egypt
-
 El Salvador
-
 Estonia
-
 Eswatini
-
 Ethiopia
-
 Finland
-
 France
-
 Georgia
-
 Germany
-
 Ghana
-
 Greece
-
 Haiti
-
 Hong Kong
-
 Hungary
-
 India
-
 Indonesia
-
 Iran, Islamic republic
-
 Iraq
-
 Ireland
-
 Israel
-
 Italy
-
 Jamaica
-
 Japan
-
 Jordan
-
 Kazakhstan
-
 Kenya
-
 Korea
-
 Kuwait
-
 Kyrgyzstan
-
 Laos
-
 Latvia
-
 Lebanon
-
 Lesotho
-
 Libya
-
 Lithuania
-
 Luxembourg
-
 Madagascar
-
 Malaysia
-
 Malta
-
 Mauritius
-
 Mexico
-
 Moldova
-
 Mongolia
-
 Montenegro
-
 Morocco
-
 Mozambique
-
 Myanmar
-
 Namibia
-
 Nepal
-
 Netherlands
-
 New Zealand
-
 Nigeria
-
 North Macedonia
-
 Norway
-
 Oman
-
 Pakistan
-
 Palestine
-
 Panama
-
 Papua New Guinea
-
 Paraguay
-
 Peru
-
 Philippines
-
 Poland
-
 Portugal
-
 Puerto Rico
-
 Qatar
-
 Reunion
-
 Romania
-
 Rwanda
-
 Saudi Arabia
-
 Serbia
-
 Singapore
-
 Slovakia
-
 Slovenia
-
 Somalia
-
 South Africa
-
 Spain
-
 Sri Lanka
-
 Sweden
-
 Switzerland
-
 Syria
-
 Taiwan
-
 Tajikistan
-
 Tanzania
-
 Thailand
-
 Trinidad and Tobago
-
 Tunisia
-
 Turkey
-
 UAE
-
 Uganda
-
 Ukraine
-
 United Kingdom
-
United States
-
 Uruguay
-
 Uzbekistan
-
 Venezuela
-
 Vietnam
-
 Yemen
-
 Zambia
-
 Zimbabwe
- Forex
- Crypto












