

Enbridge management transition and asset deals: Can ENB regain momentum?

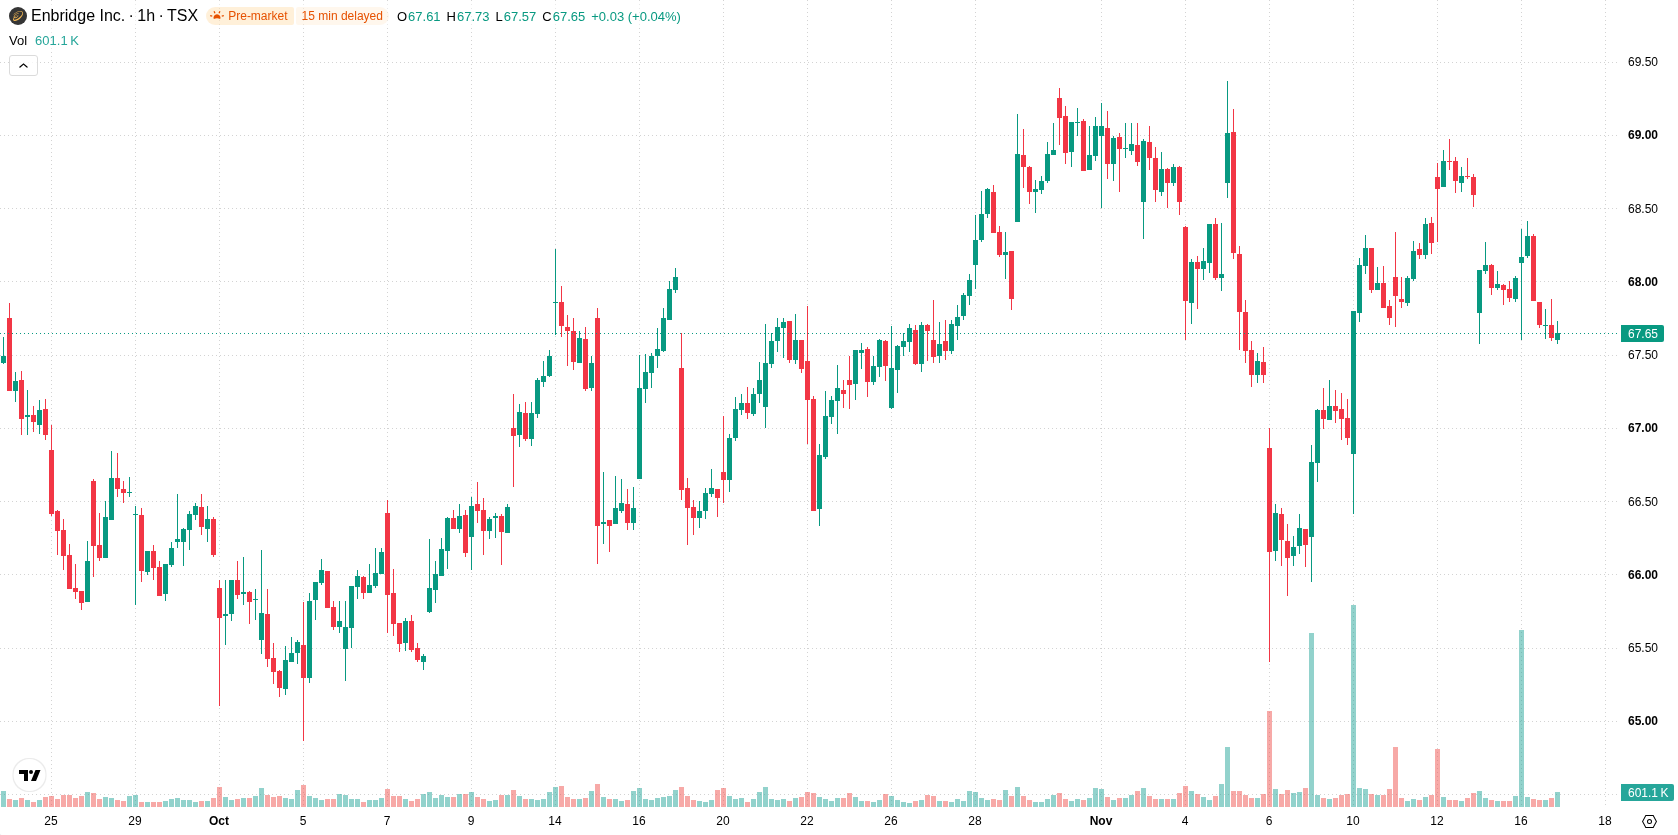
Enbridge Inc. (ENB) stock is trading at C$67.68 after slipping modestly during the session. The price remains below its key moving averages, reflecting ongoing downside momentum across short-, medium-, and long-term timeframes.
 68.08
68.97
Highlights
- Enbridge announced CEO Greg Ebel will retire at the end of 2026, with Michele Harradence confirmed to take over in January 2027, providing clarity on executive succession.
- Enbridge completed acquisitions of Tallgrass Energy and Salt Creek Midstream crude assets in October 2026, expanding its operational base.
- Shares of Enbridge trade under key moving averages with prevailing downside momentum, an expected range of C$66.56 to C$68.8, and a 75% probability of continued weakness.
Leadership transition and asset expansion ease risk but lack catalysts
Greg Ebel’s planned retirement as CEO at the end of 2026, with Michele Harradence confirmed as successor starting January 2027, clarifies Enbridge’s management transition and may ease concerns tied to executive continuity, according to Yahoo Finance. While clear succession planning can reduce uncertainty for stakeholders, it does not provide near-term price catalysts. Additionally, the completion of Enbridge’s acquisitions of Tallgrass Energy's and Salt Creek Midstream's crude assets in October 2026, as reported by Ogj, expands the company’s operational base though price action has remained under broader selling pressure.
Mixed momentum and resistance limits amid persistent selling pressure
Technically, ENB is trading below the H1 SMA-20 at C$68.17, H1 SMA-50 at C$67.69, and remains well under the D1 SMA-200 at C$72.65. The Ichimoku Kijun at C$68.27 represents immediate resistance for the price. Momentum indicators present a mixed picture: MACD is bearish, ADX is neutral, while RSI and CCI both register in the neutral range. Stochastic RSI is in the oversold zone, suggesting potential for short-term selling exhaustion. Bull/Bear Power stands negative at -0.22, indicating intraday seller dominance, and the Awesome Oscillator continues to reflect selling momentum.
Consolidation likely as lower support and upside barriers define risk
In the short term, ENB is likely to consolidate within the C$66.56 to C$68.8 volatility band relative to current levels. There is a 75% probability of continued downside and only a 25% chance of an upward move in coming sessions. The baseline scenario anticipates ongoing consolidation unless price decisively breaks above the immediate resistance, which could trigger a move higher. Conversely, a decline below the established support would indicate renewed selling pressure and a likely extension of the current downtrend.
Previously, analysts noted that Enbridge was displaying a shift toward neutral to bearish short-term momentum, with the stock's outlook closely tied to technical resistance levels. The current update reinforces this directional bias, with recent technical and fundamental developments underscoring the importance of a decisive move above C$68.27 resistance or below C$66.56 support as the next signal for trend extension.










-
 Afghanistan
-
 Albania
-
 Algeria
-
 Angola
-
 Argentina
-
 Armenia
-
 Australia
-
 Austria
-
 Azerbaijan
-
 Bahamas
-
 Bahrain
-
 Bangladesh
-
 Belarus
-
 Belgium
-
 Bolivia
-
 Botswana
-
 Brazil
-
 Brunei
-
 Bulgaria
-
 Cambodia
-
 Cameroon
-
 Canada
-
 Chile
-
 China
-
 Colombia
-
 Congo
-
 Costa Rica
-
 Cote d'Ivoire
-
 Croatia
-
 Cuba
-
 Cyprus
-
 Czechia
-
 DR Congo
-
 Denmark
-
 Dominican Republic
-
 Ecuador
-
 Egypt
-
 El Salvador
-
 Estonia
-
 Eswatini
-
 Ethiopia
-
 Finland
-
 France
-
 Georgia
-
 Germany
-
 Ghana
-
 Greece
-
 Haiti
-
 Hong Kong
-
 Hungary
-
 India
-
 Indonesia
-
 Iran, Islamic republic
-
 Iraq
-
 Ireland
-
 Israel
-
 Italy
-
 Jamaica
-
 Japan
-
 Jordan
-
 Kazakhstan
-
 Kenya
-
 Korea
-
 Kuwait
-
 Kyrgyzstan
-
 Laos
-
 Latvia
-
 Lebanon
-
 Lesotho
-
 Libya
-
 Lithuania
-
 Luxembourg
-
 Madagascar
-
 Malaysia
-
 Malta
-
 Mauritius
-
 Mexico
-
 Moldova
-
 Mongolia
-
 Montenegro
-
 Morocco
-
 Mozambique
-
 Myanmar
-
 Namibia
-
 Nepal
-
 Netherlands
-
 New Zealand
-
 Nigeria
-
 North Macedonia
-
 Norway
-
 Oman
-
 Pakistan
-
 Palestine
-
 Panama
-
 Papua New Guinea
-
 Paraguay
-
 Peru
-
 Philippines
-
 Poland
-
 Portugal
-
 Puerto Rico
-
 Qatar
-
 Reunion
-
 Romania
-
 Rwanda
-
 Saudi Arabia
-
 Serbia
-
 Singapore
-
 Slovakia
-
 Slovenia
-
 Somalia
-
 South Africa
-
 Spain
-
 Sri Lanka
-
 Sweden
-
 Switzerland
-
 Syria
-
 Taiwan
-
 Tajikistan
-
 Tanzania
-
 Thailand
-
 Trinidad and Tobago
-
 Tunisia
-
 Turkey
-
 UAE
-
 Uganda
-
 Ukraine
-
 United Kingdom
-
United States
-
 Uruguay
-
 Uzbekistan
-
 Venezuela
-
 Vietnam
-
 Yemen
-
 Zambia
-
 Zimbabwe
- Forex
- Crypto












