

VOD slides nearly 2% as shares remain below key technical levels despite earnings growth

Vodafone Group Public Limited Company (VOD) fell 1.66% as investors reacted to fresh first-half results showing positive revenue and earnings, even as overall market sentiment remained negative. The move is supported by Vodafone's positioning below its 20-day and 50-day moving averages, with selling pressure prevailing despite underlying longer-term support near the 200-day average.
 117.95
119.20
Highlights
- Vodafone reported a 5.8% rise in organic service revenue and 6.4% growth in adjusted EBITDAaL for the first half.
- The company raised its FY2027 adjusted EBITDAaL and free cash flow outlook, but posted a net loss of €3.6 to €4.8 billion and approved a higher interim dividend.
- Shares of Vodafone last traded at GBX115.75, under short- and medium-term pressure below key moving averages, with neutral momentum signals and a projected 5-day range of GBX113.65 to GBX117.85.
Upbeat revenue and dividends offset by persistent market pressure
Vodafone reported a 5.8% increase in organic service revenue and 6.4% growth in adjusted EBITDAaL for the first half of its fiscal year. The company raised its FY2027 adjusted EBITDAaL and free cash flow guidance, while posting a net loss of approximately €3.6–€4.8 billion for the same period. Vodafone also approved a higher interim dividend and amended the terms of its $2 billion capital securities, accompanied by a supplemental indenture agreement. These developments were reported, though price action has remained under broader selling pressure.
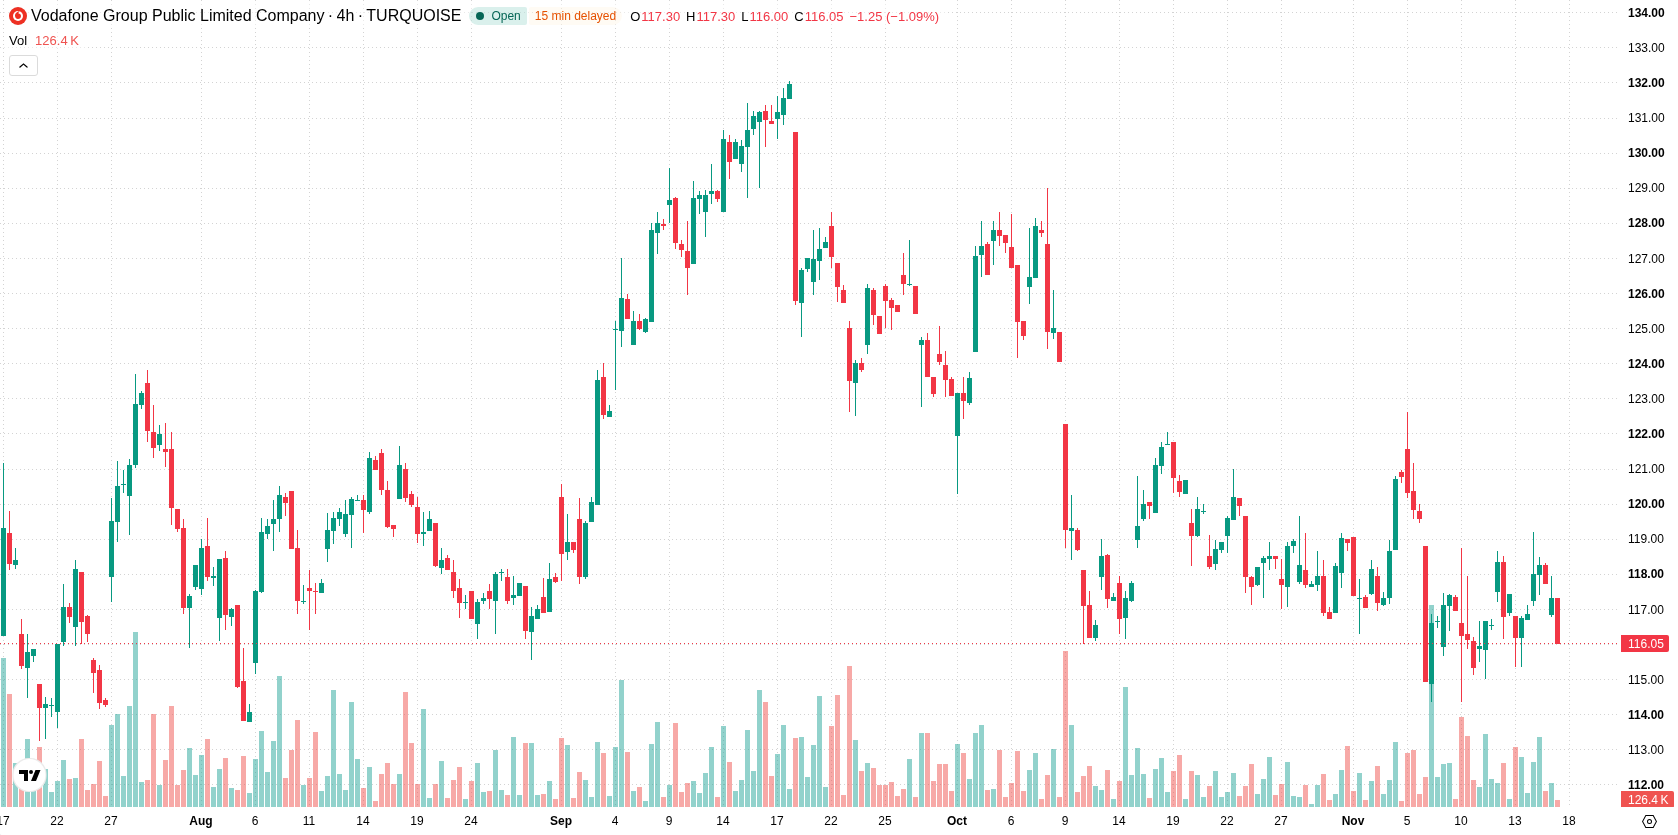
Short-term weakness evident as technical support faces mixed momentum
Vodafone is trading below its 20-day (GBX117.98) and 50-day (GBX122.19) moving averages, but remains slightly above the 200-day (GBX115.59), signaling short- and medium-term pressure from sellers, with longer-term support near the 200-day. Resistance appears near GBX117, and support aligns with the 200-day level at GBX115.59, while the Ichimoku Kijun at GBX118.5 is identified as a key trend confirmation marker above the current price. Momentum indicators are mixed: MACD points to downside bias, ADX is neutral, and RSI, Stochastic RSI, and CCI all remain in their neutral zones. Bull/Bear Power suggests buyers are active intraday, whereas the Awesome Oscillator provides a neutral reading. Vodafone's intraday action has been marked by pressure and limited volatility.
Earlier, analysts noted that Vodafone’s fundamentals were improving but technical signals warranted a cautious outlook. The latest results reinforce that outlook, with recent price action and updated forecasts highlighting GBX115.59 as the critical support level to monitor for potential downside risk.






Latest Vodafone News



-
 Afghanistan
-
 Albania
-
 Algeria
-
 Angola
-
 Argentina
-
 Armenia
-
 Australia
-
 Austria
-
 Azerbaijan
-
 Bahamas
-
 Bahrain
-
 Bangladesh
-
 Belarus
-
 Belgium
-
 Bolivia
-
 Botswana
-
 Brazil
-
 Brunei
-
 Bulgaria
-
 Cambodia
-
 Cameroon
-
 Canada
-
 Chile
-
 China
-
 Colombia
-
 Congo
-
 Costa Rica
-
 Cote d'Ivoire
-
 Croatia
-
 Cuba
-
 Cyprus
-
 Czechia
-
 DR Congo
-
 Denmark
-
 Dominican Republic
-
 Ecuador
-
 Egypt
-
 El Salvador
-
 Estonia
-
 Eswatini
-
 Ethiopia
-
 Finland
-
 France
-
 Georgia
-
 Germany
-
 Ghana
-
 Greece
-
 Haiti
-
 Hong Kong
-
 Hungary
-
 India
-
 Indonesia
-
 Iran, Islamic republic
-
 Iraq
-
 Ireland
-
 Israel
-
 Italy
-
 Jamaica
-
 Japan
-
 Jordan
-
 Kazakhstan
-
 Kenya
-
 Korea
-
 Kuwait
-
 Kyrgyzstan
-
 Laos
-
 Latvia
-
 Lebanon
-
 Lesotho
-
 Libya
-
 Lithuania
-
 Luxembourg
-
 Madagascar
-
 Malaysia
-
 Malta
-
 Mauritius
-
 Mexico
-
 Moldova
-
 Mongolia
-
 Montenegro
-
 Morocco
-
 Mozambique
-
 Myanmar
-
 Namibia
-
 Nepal
-
 Netherlands
-
 New Zealand
-
 Nigeria
-
 North Macedonia
-
 Norway
-
 Oman
-
 Pakistan
-
 Palestine
-
 Panama
-
 Papua New Guinea
-
 Paraguay
-
 Peru
-
 Philippines
-
 Poland
-
 Portugal
-
 Puerto Rico
-
 Qatar
-
 Reunion
-
 Romania
-
 Rwanda
-
 Saudi Arabia
-
 Serbia
-
 Singapore
-
 Slovakia
-
 Slovenia
-
 Somalia
-
 South Africa
-
 Spain
-
 Sri Lanka
-
 Sweden
-
 Switzerland
-
 Syria
-
 Taiwan
-
 Tajikistan
-
 Tanzania
-
 Thailand
-
 Trinidad and Tobago
-
 Tunisia
-
 Turkey
-
 UAE
-
 Uganda
-
 Ukraine
-
 United Kingdom
-
United States
-
 Uruguay
-
 Uzbekistan
-
 Venezuela
-
 Vietnam
-
 Yemen
-
 Zambia
-
 Zimbabwe
- Forex
- Crypto












