

Meta Platforms faces negative S&P credit outlook and Italian fine: Can META avoid deeper losses?

Meta Platforms (META) stock is trading at $625.22, down 2.59% on the day. The stock remains positioned below its key moving averages, reflecting continued downward momentum across short- and long-term timeframes.
 640.70
645.71
Highlights
- Meta Platforms reported Q3 revenue of $64.60 billion, up 26% year over year, but free cash flow was negative $2.12 billion.
- Meta faces an €805 million privacy fine from Italian authorities and S&P downgraded its credit outlook to negative as borrowing costs rise.
- Meta stock trades with downside momentum, key indicators show sell signals, and the 2–3 day range is expected at $612.89 to $637.55.
Legal costs and credit outlook strain sentiment despite revenue growth
Meta Platforms reported Q3 revenue of $64.60 billion, up 26% year over year, but its free cash flow for the quarter was negative $2.12 billion due to high spending and legal costs, according to TradingView. The company also faced a substantial €805 million fine from the Italian data protection authority for privacy violations related to Android device gallery access, which Meta has announced it will appeal, as reported by Scworld. S&P lowered its credit outlook on Meta to negative as borrowing costs have risen, according to Inkl, while the company remains active in debt markets, recently raising approximately $25 billion in net bond proceeds and $14.3 billion from preferred shares.
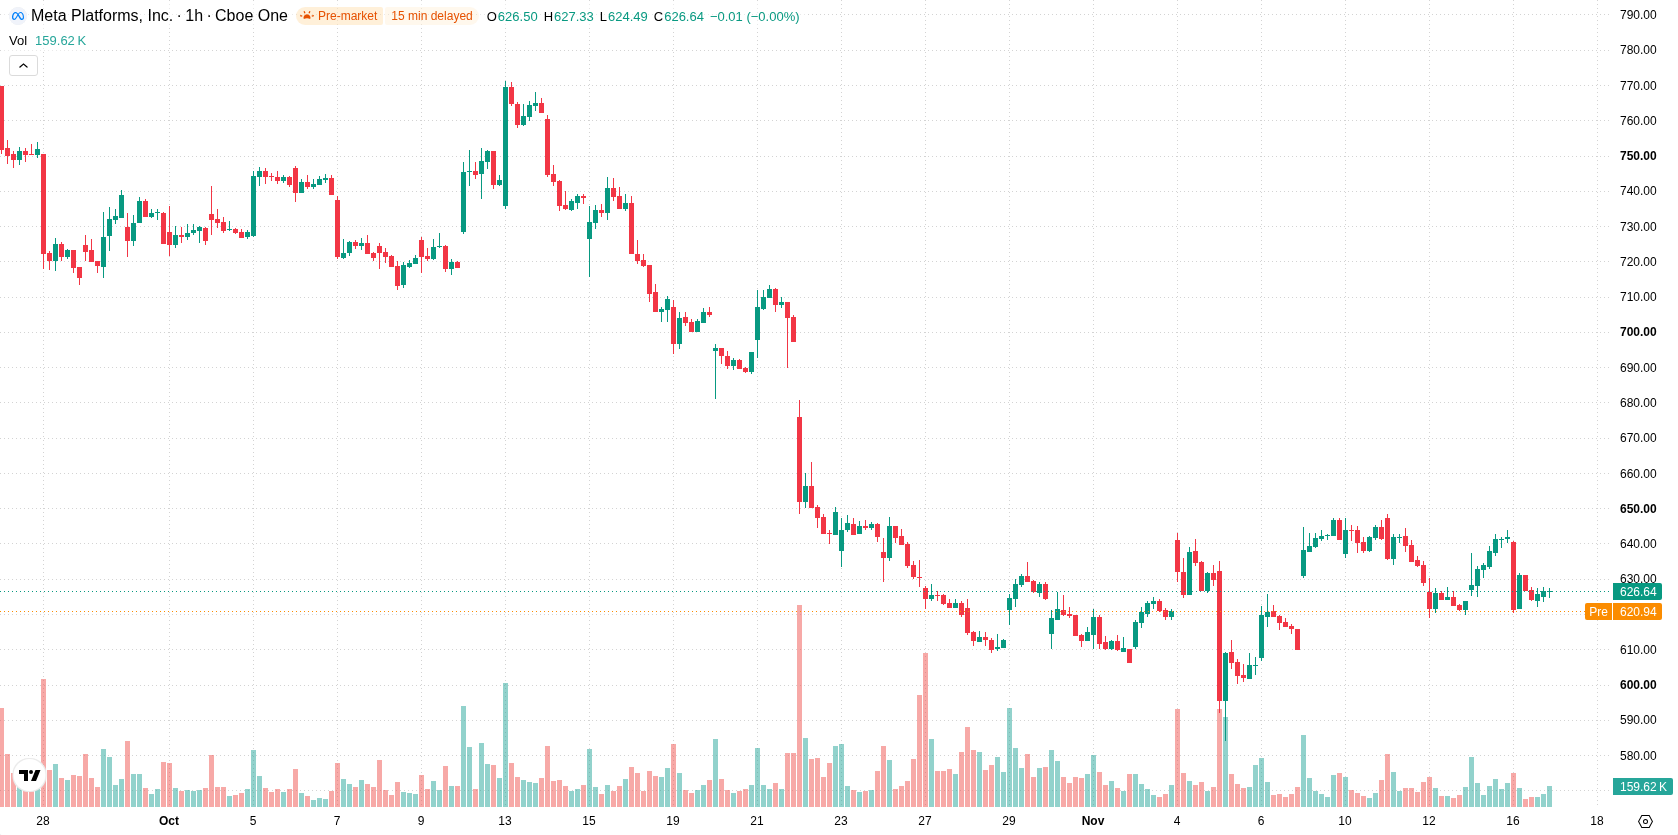
Resistance caps price as negative signals coincide with selling dominance
On the technical side, META/USD is trading below the H1 SMA-20 at $628.9, H1 SMA-50 at $632.36, and D1 SMA-200 at $630.28. The immediate resistance is set at the Ichimoku Kijun level of $631.68. MACD and ADX both show sell signals, indicating negative short-term momentum. RSI, Stoch RSI, and CCI remain in neutral ranges, suggesting no immediate overbought or oversold conditions, while Bull/Bear Power stands at -1.41, reflecting dominance by sellers; the Awesome Oscillator currently reads neutral.
Further downside likely as volatility range contains upside risks
Over the next 2-3 days, META is projected to trade within a typical volatility band from $612.89 to $637.55. The probability for continued downside is high, with an upward move seen as unlikely under present conditions. Sideways action within this range is the baseline expectation unless momentum shifts. A clear break above $631.68 would open the door for gains toward the range high, while a drop below $612.89 would confirm further weakness.
Previously, it was reported that Meta has been intensifying its recruitment of legal talent from elite law firms as regulatory and artificial intelligence challenges increase across the technology sector. This current technical setup, coupled with renewed legal headwinds and higher operating costs, suggests that traders should closely monitor META’s ability to sustain support above $612.89 as pressure for further downside risk mounts in the near term.











-
 Afghanistan
-
 Albania
-
 Algeria
-
 Angola
-
 Argentina
-
 Armenia
-
 Australia
-
 Austria
-
 Azerbaijan
-
 Bahamas
-
 Bahrain
-
 Bangladesh
-
 Belarus
-
 Belgium
-
 Bolivia
-
 Botswana
-
 Brazil
-
 Brunei
-
 Bulgaria
-
 Cambodia
-
 Cameroon
-
 Canada
-
 Chile
-
 China
-
 Colombia
-
 Congo
-
 Costa Rica
-
 Cote d'Ivoire
-
 Croatia
-
 Cuba
-
 Cyprus
-
 Czechia
-
 DR Congo
-
 Denmark
-
 Dominican Republic
-
 Ecuador
-
 Egypt
-
 El Salvador
-
 Estonia
-
 Eswatini
-
 Ethiopia
-
 Finland
-
 France
-
 Georgia
-
 Germany
-
 Ghana
-
 Greece
-
 Haiti
-
 Hong Kong
-
 Hungary
-
 India
-
 Indonesia
-
 Iran, Islamic republic
-
 Iraq
-
 Ireland
-
 Israel
-
 Italy
-
 Jamaica
-
 Japan
-
 Jordan
-
 Kazakhstan
-
 Kenya
-
 Korea
-
 Kuwait
-
 Kyrgyzstan
-
 Laos
-
 Latvia
-
 Lebanon
-
 Lesotho
-
 Libya
-
 Lithuania
-
 Luxembourg
-
 Madagascar
-
 Malaysia
-
 Malta
-
 Mauritius
-
 Mexico
-
 Moldova
-
 Mongolia
-
 Montenegro
-
 Morocco
-
 Mozambique
-
 Myanmar
-
 Namibia
-
 Nepal
-
 Netherlands
-
 New Zealand
-
 Nigeria
-
 North Macedonia
-
 Norway
-
 Oman
-
 Pakistan
-
 Palestine
-
 Panama
-
 Papua New Guinea
-
 Paraguay
-
 Peru
-
 Philippines
-
 Poland
-
 Portugal
-
 Puerto Rico
-
 Qatar
-
 Reunion
-
 Romania
-
 Rwanda
-
 Saudi Arabia
-
 Serbia
-
 Singapore
-
 Slovakia
-
 Slovenia
-
 Somalia
-
 South Africa
-
 Spain
-
 Sri Lanka
-
 Sweden
-
 Switzerland
-
 Syria
-
 Taiwan
-
 Tajikistan
-
 Tanzania
-
 Thailand
-
 Trinidad and Tobago
-
 Tunisia
-
 Turkey
-
 UAE
-
 Uganda
-
 Ukraine
-
 United Kingdom
-
United States
-
 Uruguay
-
 Uzbekistan
-
 Venezuela
-
 Vietnam
-
 Yemen
-
 Zambia
-
 Zimbabwe
- Forex
- Crypto












