

Alphabet makes $10 billion Anthropic investment: Can GOOGL avoid deeper losses?

Alphabet Inc. (GOOGL) stock is trading at $284.46, down 3.84% for the day. The price remains below its key moving averages, highlighting continued downside pressure following a broad retracement.
 294.14
304.22
Highlights
- Alphabet invested $10 billion in Anthropic, acquiring 135 million shares in a private placement ahead of the IPO.
- A $200 billion infrastructure commitment and ongoing regulatory scrutiny have increased risk aversion among investors.
- Shares of Alphabet fell 3.84% to $284.46 as bearish technical momentum prevails, with the forecast range at $274.97 to $293.95 over the next few days.
Investor caution rises amid AI investments and regulatory concerns
Alphabet made a substantial $10 billion investment in Anthropic, acquiring 135 million shares through a private placement ahead of the anticipated IPO, according to Gurufocus. This major allocation of capital to artificial intelligence ventures, together with ongoing concerns over Alphabet’s $200 billion infrastructure spending and persistent regulatory scrutiny, has heightened investor uncertainty and contributed to near-term risk aversion. Positive momentum from Google Cloud and recent product launches, as noted by FXLeaders, has offered some underlying support, but broader sentiment continues to reflect caution amid these large-scale commitments.
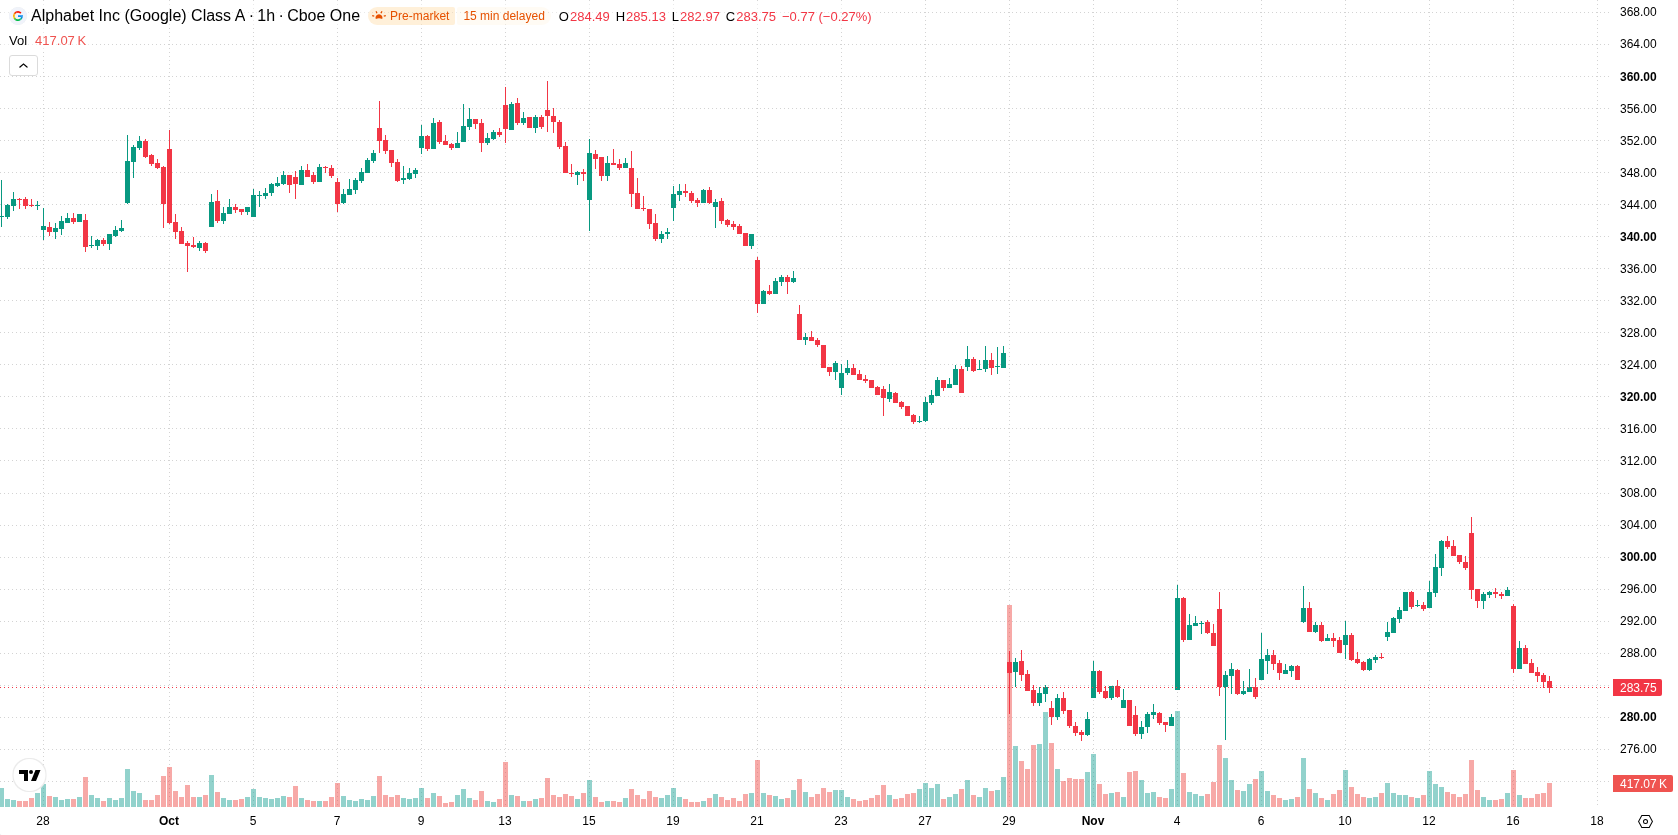
Bearish momentum dominates as oversold signals emerge at resistance
On the technical front, GOOGL/USD is trading below H1 SMA-20 at $292.54, H1 SMA-50 at $291.34, and D1 SMA-200 at $338.21. The Ichimoku Kijun stands at $293.97, marking immediate resistance. Momentum indicators show persistent bearish signals, with MACD and ADX confirming a selling setup. RSI remains in the neutral zone, while Stochastic RSI and CCI are in oversold territory, indicating the possibility of selling exhaustion. Bull/Bear Power is negative at -3.85, and the Awesome Oscillator also supports ongoing bearish momentum. The mixed readings from oscillators and the strength of downward momentum create a complex and cautious technical outlook.
Sideways action favored as volatile range and downside risk persist
Over the next 2–3 trading days, GOOGL/USD is likely to fluctuate within a range of $274.97 to $293.95, reflecting typical volatility relative to current levels. There is a 76% probability of a continued downward move, while an upward scenario holds a 24% chance. The base case points to sideways trading between support and resistance. A decisive break above $293.97 could signal a push toward the upper end of the range, while selling below $274.97 may drive the price lower and extend the decline.
Previously it was reported that Google has identified a rapid evolution in AI-driven cybersecurity threats, with attackers leveraging autonomous large language model frameworks to automate vulnerability discovery and exploitation. Against this backdrop of heightened risk and Alphabet’s substantial AI investments, the current price action highlights the importance of monitoring the $293.97 level as a key technical pivot that could signal either renewed upside momentum or an extension of the recent decline.






Latest Google News




-
 Afghanistan
-
 Albania
-
 Algeria
-
 Angola
-
 Argentina
-
 Armenia
-
 Australia
-
 Austria
-
 Azerbaijan
-
 Bahamas
-
 Bahrain
-
 Bangladesh
-
 Belarus
-
 Belgium
-
 Bolivia
-
 Botswana
-
 Brazil
-
 Brunei
-
 Bulgaria
-
 Cambodia
-
 Cameroon
-
 Canada
-
 Chile
-
 China
-
 Colombia
-
 Congo
-
 Costa Rica
-
 Cote d'Ivoire
-
 Croatia
-
 Cuba
-
 Cyprus
-
 Czechia
-
 DR Congo
-
 Denmark
-
 Dominican Republic
-
 Ecuador
-
 Egypt
-
 El Salvador
-
 Estonia
-
 Eswatini
-
 Ethiopia
-
 Finland
-
 France
-
 Georgia
-
 Germany
-
 Ghana
-
 Greece
-
 Haiti
-
 Hong Kong
-
 Hungary
-
 India
-
 Indonesia
-
 Iran, Islamic republic
-
 Iraq
-
 Ireland
-
 Israel
-
 Italy
-
 Jamaica
-
 Japan
-
 Jordan
-
 Kazakhstan
-
 Kenya
-
 Korea
-
 Kuwait
-
 Kyrgyzstan
-
 Laos
-
 Latvia
-
 Lebanon
-
 Lesotho
-
 Libya
-
 Lithuania
-
 Luxembourg
-
 Madagascar
-
 Malaysia
-
 Malta
-
 Mauritius
-
 Mexico
-
 Moldova
-
 Mongolia
-
 Montenegro
-
 Morocco
-
 Mozambique
-
 Myanmar
-
 Namibia
-
 Nepal
-
 Netherlands
-
 New Zealand
-
 Nigeria
-
 North Macedonia
-
 Norway
-
 Oman
-
 Pakistan
-
 Palestine
-
 Panama
-
 Papua New Guinea
-
 Paraguay
-
 Peru
-
 Philippines
-
 Poland
-
 Portugal
-
 Puerto Rico
-
 Qatar
-
 Reunion
-
 Romania
-
 Rwanda
-
 Saudi Arabia
-
 Serbia
-
 Singapore
-
 Slovakia
-
 Slovenia
-
 Somalia
-
 South Africa
-
 Spain
-
 Sri Lanka
-
 Sweden
-
 Switzerland
-
 Syria
-
 Taiwan
-
 Tajikistan
-
 Tanzania
-
 Thailand
-
 Trinidad and Tobago
-
 Tunisia
-
 Turkey
-
 UAE
-
 Uganda
-
 Ukraine
-
 United Kingdom
-
United States
-
 Uruguay
-
 Uzbekistan
-
 Venezuela
-
 Vietnam
-
 Yemen
-
 Zambia
-
 Zimbabwe
- Forex
- Crypto












