

AMD stock falls amid downward price move and weak momentum

Advanced Micro Devices (AMD) stock is trading at $504.71, down 5.51% on the day. The price has moved below its key short- and medium-term moving averages, while still maintaining a position above long-term support levels.
 506.38
593.63
Highlights
- Shares of AMD fell 4.25% on November 16, 2026, after dropping 8.75% the previous day.
- Consecutive stock losses increased bearish momentum and led to intensified selling activity in the current session.
- Technical indicators show strong selling pressure with a high probability of decline toward $463.38, while a rebound above $547.65 would be needed for a bullish shift.
Bearish momentum intensifies after consecutive selloffs
AMD experienced consecutive share price declines as reported by Gurufocus, with a 4.25% drop on November 16, 2026, following an 8.75% decline the previous trading day. This sequence of losses reflects negative investor sentiment, prompting further reactive selling among market participants. The continued drawdown intensified bearish momentum and weighed on the stock in the current session.
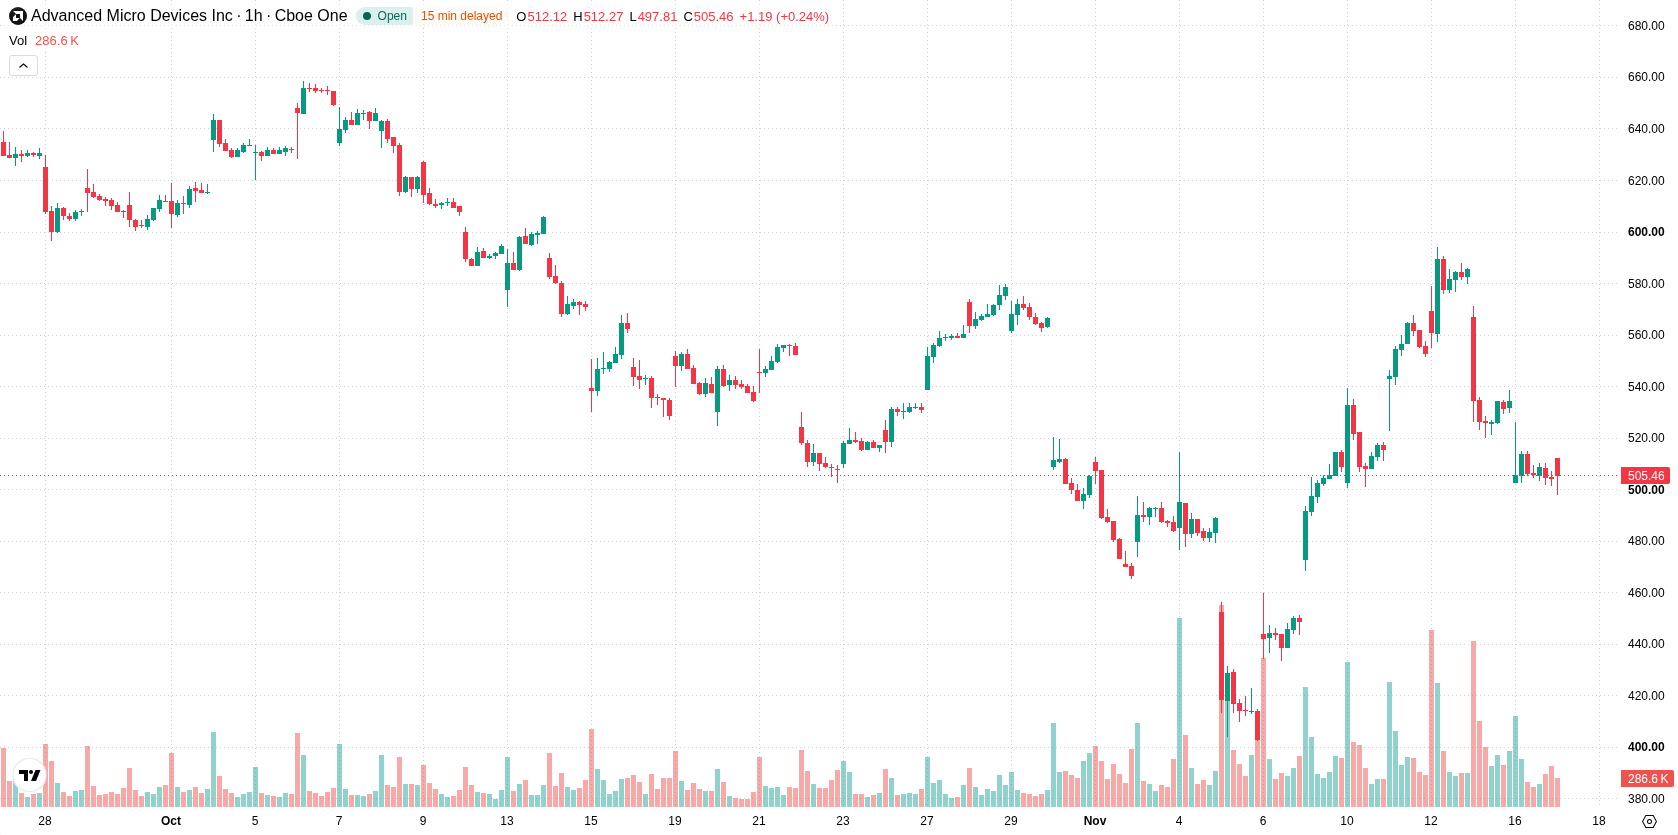
Downward bias persists as resistance holds and indicators weaken
Technically, AMD is trading below the H1 SMA-20 at $531.39 and the H1 SMA-50 at $527.54, while holding above the D1 SMA-200 at $424.42. Immediate resistance is defined by the Ichimoku Kijun at $547.65. Both the MACD and ADX are signaling sell conditions, indicating prevailing downward momentum, while the RSI and CCI remain in neutral territory. The Stochastic RSI has entered the oversold zone, suggesting the potential for a short-term bounce, though this is not yet confirmed. Bull/Bear Power registers at -11.5, showing clear intraday seller dominance, and the Awesome Oscillator direction continues to align with the broader downtrend.
Downside risk prevails unless resistance breaks
In the short term, AMD is likely to remain volatile within the $463.38 to $546.04 range. The probability of further downside movement is much higher than that of an immediate rebound. A break above resistance at $547.65 would open the door for a bullish reversal scenario, while a fall below $463.38 would suggest extended weakness. If AMD remains within the marked range, price action could transition into a sideways consolidation reflecting typical volatility around current levels.
Earlier, analysts noted that AMD's long-term prospects were improving amid AI-driven developments and major sector events, although the company's near-term outlook remained closely linked to broader semiconductor market volatility. With momentum indicators now signaling ongoing downside pressure and the stock consolidating above key long-term support, traders should monitor the $463.38 level as a critical threshold that may define the prevailing scenario in the coming sessions.











-
 Afghanistan
-
 Albania
-
 Algeria
-
 Angola
-
 Argentina
-
 Armenia
-
 Australia
-
 Austria
-
 Azerbaijan
-
 Bahamas
-
 Bahrain
-
 Bangladesh
-
 Belarus
-
 Belgium
-
 Bolivia
-
 Botswana
-
 Brazil
-
 Brunei
-
 Bulgaria
-
 Cambodia
-
 Cameroon
-
 Canada
-
 Chile
-
 China
-
 Colombia
-
 Congo
-
 Costa Rica
-
 Cote d'Ivoire
-
 Croatia
-
 Cuba
-
 Cyprus
-
 Czechia
-
 DR Congo
-
 Denmark
-
 Dominican Republic
-
 Ecuador
-
 Egypt
-
 El Salvador
-
 Estonia
-
 Eswatini
-
 Ethiopia
-
 Finland
-
 France
-
 Georgia
-
 Germany
-
 Ghana
-
 Greece
-
 Haiti
-
 Hong Kong
-
 Hungary
-
 India
-
 Indonesia
-
 Iran, Islamic republic
-
 Iraq
-
 Ireland
-
 Israel
-
 Italy
-
 Jamaica
-
 Japan
-
 Jordan
-
 Kazakhstan
-
 Kenya
-
 Korea
-
 Kuwait
-
 Kyrgyzstan
-
 Laos
-
 Latvia
-
 Lebanon
-
 Lesotho
-
 Libya
-
 Lithuania
-
 Luxembourg
-
 Madagascar
-
 Malaysia
-
 Malta
-
 Mauritius
-
 Mexico
-
 Moldova
-
 Mongolia
-
 Montenegro
-
 Morocco
-
 Mozambique
-
 Myanmar
-
 Namibia
-
 Nepal
-
 Netherlands
-
 New Zealand
-
 Nigeria
-
 North Macedonia
-
 Norway
-
 Oman
-
 Pakistan
-
 Palestine
-
 Panama
-
 Papua New Guinea
-
 Paraguay
-
 Peru
-
 Philippines
-
 Poland
-
 Portugal
-
 Puerto Rico
-
 Qatar
-
 Reunion
-
 Romania
-
 Rwanda
-
 Saudi Arabia
-
 Serbia
-
 Singapore
-
 Slovakia
-
 Slovenia
-
 Somalia
-
 South Africa
-
 Spain
-
 Sri Lanka
-
 Sweden
-
 Switzerland
-
 Syria
-
 Taiwan
-
 Tajikistan
-
 Tanzania
-
 Thailand
-
 Trinidad and Tobago
-
 Tunisia
-
 Turkey
-
 UAE
-
 Uganda
-
 Ukraine
-
 United Kingdom
-
United States
-
 Uruguay
-
 Uzbekistan
-
 Venezuela
-
 Vietnam
-
 Yemen
-
 Zambia
-
 Zimbabwe
- Forex
- Crypto












