

Godaddy stock slides as sellers dominate and support pressure intensifies

Godaddy (GDDY) stock is trading at $108.3, falling 3.52% for the day in a volatile session that brought a sharp decline. The price currently sits below its key short- and medium-term moving averages but remains above its long-term benchmark.
 110.95
115.81
Highlights
- GoDaddy launched Airo AI Builder, enabling small businesses to create websites and online stores using AI prompts.
- Airo AI Builder serves as an agentic operating system for small businesses, expanding GoDaddy's AI product lineup.
- GoDaddy stock fell 3.52% to $108.3 with technicals showing strong short-term selling pressure and a forecasted range of $106.47 to $113.42.
AI product expansion targets adoption as stock faces selling pressure
GoDaddy Inc. recently launched Airo AI Builder, a new tool that enables small businesses to develop websites, web applications, and online stores using AI-driven text or voice prompts, according to Investing.com. This move expands GoDaddy's product offerings towards AI-powered solutions, aiming to capture greater adoption and utility among its small business customer base. Additionally, the company introduced Airo AI Builder as an agentic operating system for small businesses, as outlined in a press release distributed via PR Newswire, signaling further alignment with emerging AI workflows though price action has remained under broader selling pressure.
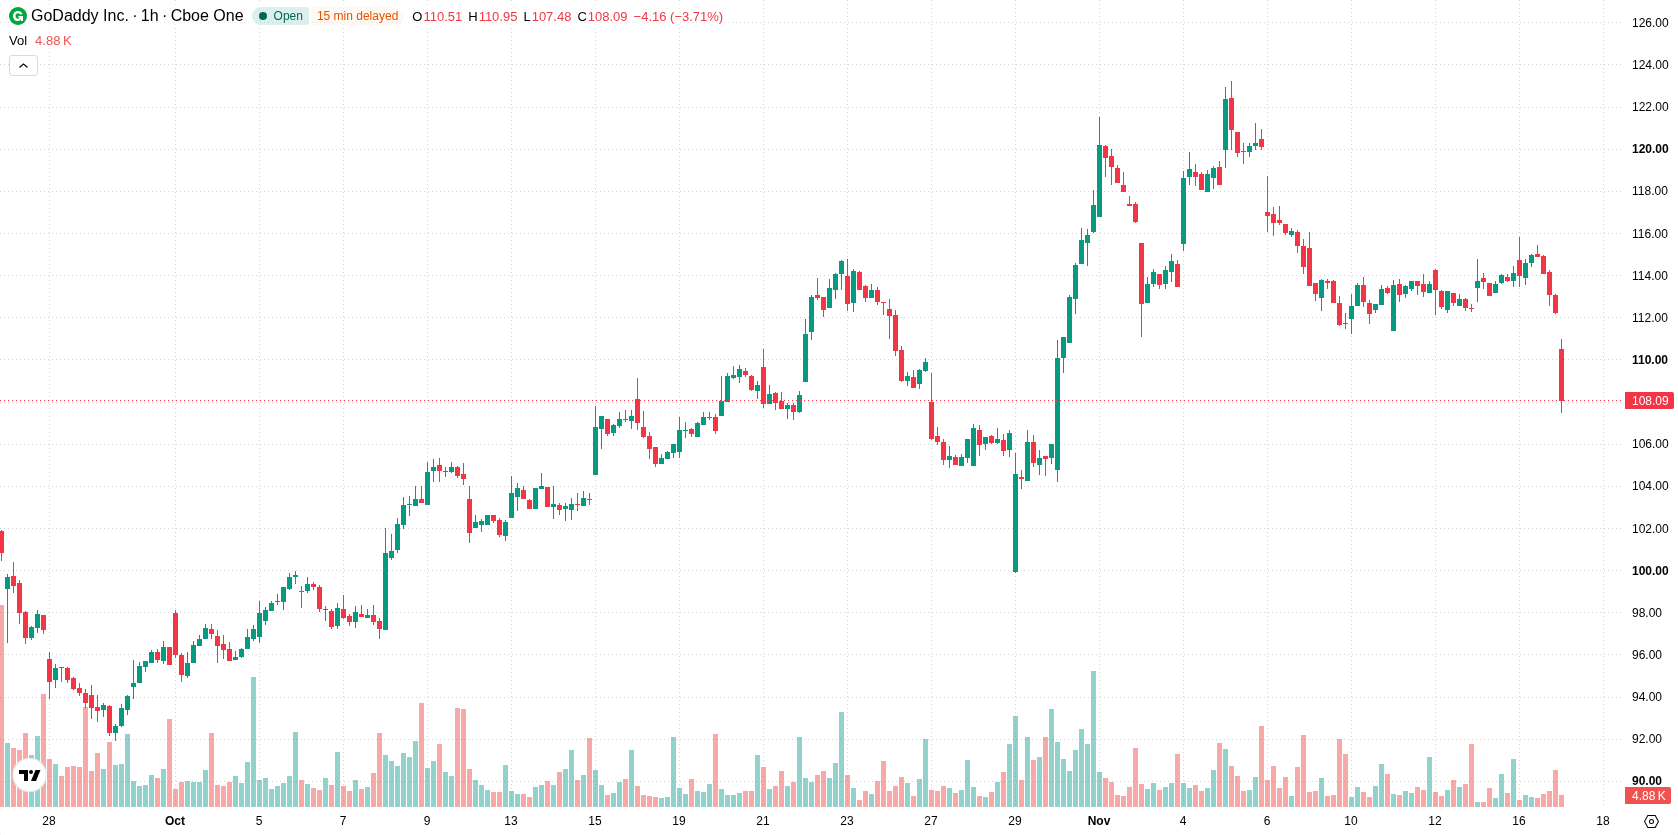
Bearish momentum persists as sellers dominate below resistance levels
Technically, GDDY is trading below the H1 SMA-20 at $113.5 and the H1 SMA-50 at $113.8, but it remains above the D1 SMA-200 at $92.51. The Ichimoku Kijun on the H1 timeframe stands at $113.92, acting as immediate resistance. Momentum is mixed: MACD and Awesome Oscillator are neutral, while ADX indicates a sell bias. Among oscillators, RSI is neutral; Stochastic RSI and CCI are both in the oversold zone. Bull/Bear Power is negative at -0.61, reflecting intraday dominance by sellers and persistent downward pressure amid elevated volatility.
Rangebound trading expected as downside probability outweighs bullish risk
In the short term, GDDY is expected to trade within a range of $106.47 to $113.42 based on typical volatility. The probability of a move to the downside is higher at 68%, while a move up has a 32% probability. The baseline scenario is for sideways consolidation within this corridor. A bullish case would require a breakout above resistance at $113.92, while a decisive drop below $106.47 would trigger further bearish momentum.
Previously it was reported that GoDaddy's introduction of the Airo AI Builder showcased the company's expanding focus on AI-powered solutions for small businesses. The current article adds that, despite this innovation, Godaddy shares are facing sustained selling pressure with downside risks prevailing and $106.47 marked as a critical support level to monitor.










-
 Afghanistan
-
 Albania
-
 Algeria
-
 Angola
-
 Argentina
-
 Armenia
-
 Australia
-
 Austria
-
 Azerbaijan
-
 Bahamas
-
 Bahrain
-
 Bangladesh
-
 Belarus
-
 Belgium
-
 Bolivia
-
 Botswana
-
 Brazil
-
 Brunei
-
 Bulgaria
-
 Cambodia
-
 Cameroon
-
 Canada
-
 Chile
-
 China
-
 Colombia
-
 Congo
-
 Costa Rica
-
 Cote d'Ivoire
-
 Croatia
-
 Cuba
-
 Cyprus
-
 Czechia
-
 DR Congo
-
 Denmark
-
 Dominican Republic
-
 Ecuador
-
 Egypt
-
 El Salvador
-
 Estonia
-
 Eswatini
-
 Ethiopia
-
 Finland
-
 France
-
 Georgia
-
 Germany
-
 Ghana
-
 Greece
-
 Haiti
-
 Hong Kong
-
 Hungary
-
 India
-
 Indonesia
-
 Iran, Islamic republic
-
 Iraq
-
 Ireland
-
 Israel
-
 Italy
-
 Jamaica
-
 Japan
-
 Jordan
-
 Kazakhstan
-
 Kenya
-
 Korea
-
 Kuwait
-
 Kyrgyzstan
-
 Laos
-
 Latvia
-
 Lebanon
-
 Lesotho
-
 Libya
-
 Lithuania
-
 Luxembourg
-
 Madagascar
-
 Malaysia
-
 Malta
-
 Mauritius
-
 Mexico
-
 Moldova
-
 Mongolia
-
 Montenegro
-
 Morocco
-
 Mozambique
-
 Myanmar
-
 Namibia
-
 Nepal
-
 Netherlands
-
 New Zealand
-
 Nigeria
-
 North Macedonia
-
 Norway
-
 Oman
-
 Pakistan
-
 Palestine
-
 Panama
-
 Papua New Guinea
-
 Paraguay
-
 Peru
-
 Philippines
-
 Poland
-
 Portugal
-
 Puerto Rico
-
 Qatar
-
 Reunion
-
 Romania
-
 Rwanda
-
 Saudi Arabia
-
 Serbia
-
 Singapore
-
 Slovakia
-
 Slovenia
-
 Somalia
-
 South Africa
-
 Spain
-
 Sri Lanka
-
 Sweden
-
 Switzerland
-
 Syria
-
 Taiwan
-
 Tajikistan
-
 Tanzania
-
 Thailand
-
 Trinidad and Tobago
-
 Tunisia
-
 Turkey
-
 UAE
-
 Uganda
-
 Ukraine
-
 United Kingdom
-
United States
-
 Uruguay
-
 Uzbekistan
-
 Venezuela
-
 Vietnam
-
 Yemen
-
 Zambia
-
 Zimbabwe
- Forex
- Crypto












