

Adobe shares technical analysis: Sellers dominate as $229.58 support attracts attention

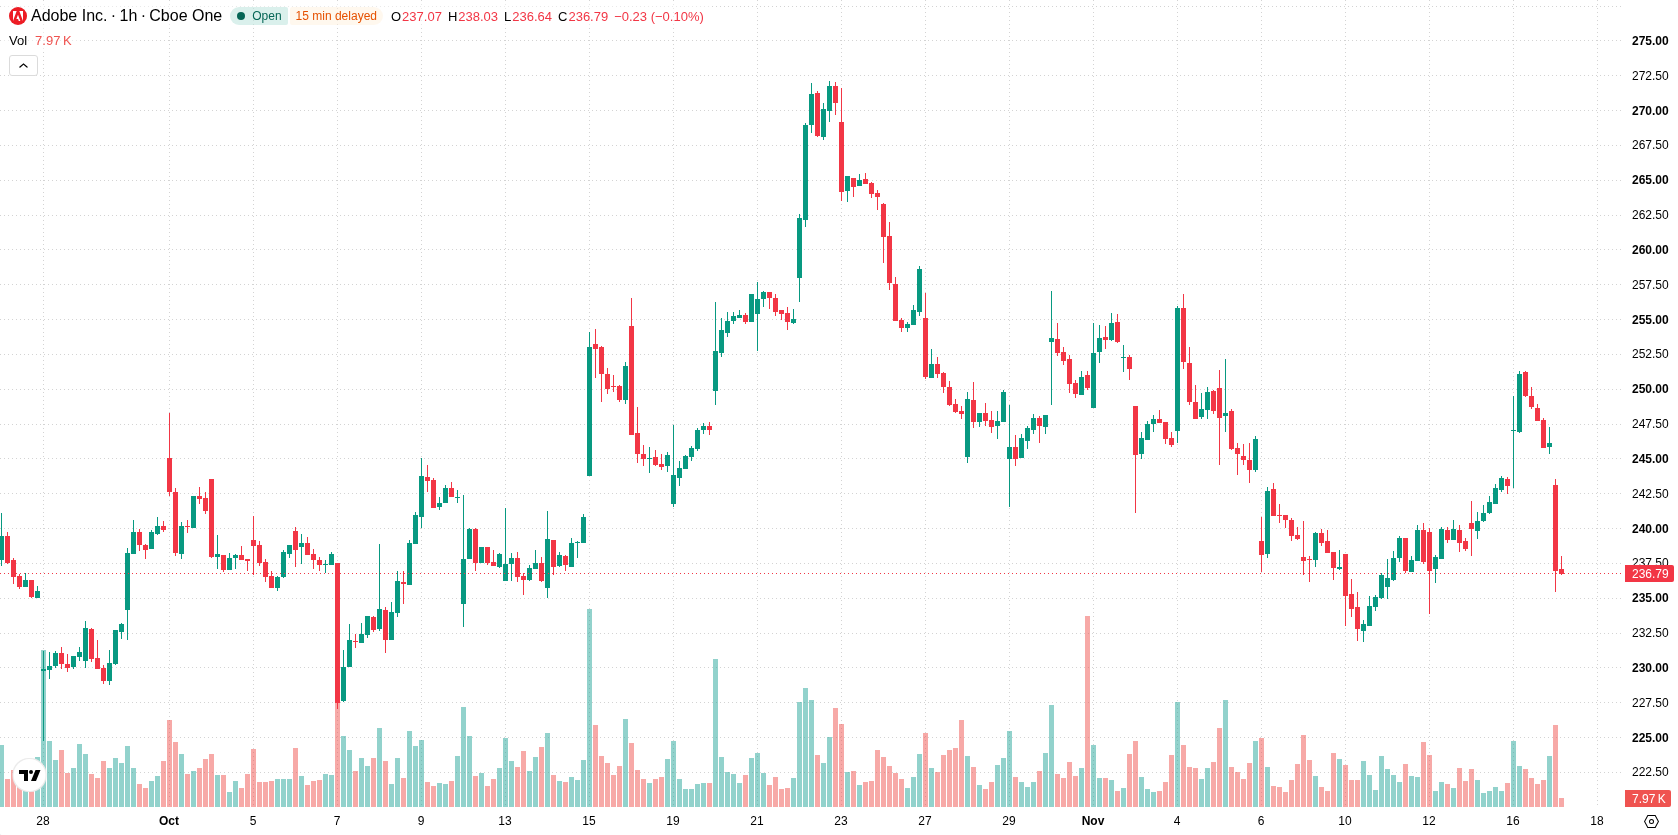
Adobe Inc. (ADBE) stock is trading at $236.88 after a decrease of 3.71% today. The price currently sits below its key moving averages, indicating continued selling pressure across multiple timeframes.
 238.81
251.28
Highlights
- Adobe expanded its partnership with Google, integrating creative tools with Google Workspace, Gemini, and Search, and adding Google’s AI models into Adobe applications.
- New AI agents and creative capabilities were announced at Adobe MAX, advancing Adobe’s push in generative AI and expanding its digital ecosystem.
- Adobe stock fell 3.71% to $236.88, trading below key averages with a projected range of $229.58 to $248.23 and bearish momentum prevailing.
Expanded Google alliance boosts AI push amid institutional interest
Adobe and Google have expanded their partnership, integrating Adobe creative tools with Google Workspace, Gemini, and Search, as well as bringing Google’s image and video models into Adobe applications including Firefly and Photoshop, Socialsamosa reported. This collaboration is set to deepen Adobe’s reach in the AI-powered productivity and creative software space, potentially enhancing its digital ecosystem and long-term growth prospects. Additional product announcements at the Adobe MAX conference, including new AI agents and creative expansions, further reinforce Adobe’s strategic push in generative AI, according to Martechcube, while a notable share purchase by Michael Burry at around $246, highlighted by Seeking Alpha, signals ongoing institutional interest — though price action has remained under broader selling pressure.
Resistance holds as mixed indicators cap momentum recovery
Technically, ADBE/USD is trading below the H1 SMA-20 at $243.16, the H1 SMA-50 at $239.85, and the D1 SMA-200 at $247.41. The Ichimoku Kijun at $242.43 represents a key resistance level in the current structure. MACD signals strong buy momentum, but this is offset by the ADX remaining in sell territory, indicating conflicting trend strength. RSI and CCI readings are both neutral, while Stochastic RSI is in the oversold range, pointing to short-term exhaustion in the latest decline. Bull/Bear Power is negative at -0.8, confirming dominance by sellers during recent sessions. Volatility has stayed elevated with price closing near its session low.
Range consolidation likely as downside risk outweighs breakout odds
Over the next two to three trading days, ADBE/USD is forecast to remain within a volatility band from $229.58 to $248.23. There is a 22% probability of an upward breakout, making continued downward movement more likely in the near term. The baseline scenario sees price consolidation within this corridor, while a decisive move above resistance could trigger renewed buying interest, and a breach below support would suggest further downside risk.
Previously it was reported that Adobe shares had shifted toward a bullish technical setup amid continued advances in AI integration and new partnerships. The current analysis, however, reflects prolonged downside pressure as the stock trades below key moving averages, making the $242.43 resistance level a critical threshold to watch for signs of any potential reversal.









-
 Afghanistan
-
 Albania
-
 Algeria
-
 Angola
-
 Argentina
-
 Armenia
-
 Australia
-
 Austria
-
 Azerbaijan
-
 Bahamas
-
 Bahrain
-
 Bangladesh
-
 Belarus
-
 Belgium
-
 Bolivia
-
 Botswana
-
 Brazil
-
 Brunei
-
 Bulgaria
-
 Cambodia
-
 Cameroon
-
 Canada
-
 Chile
-
 China
-
 Colombia
-
 Congo
-
 Costa Rica
-
 Cote d'Ivoire
-
 Croatia
-
 Cuba
-
 Cyprus
-
 Czechia
-
 DR Congo
-
 Denmark
-
 Dominican Republic
-
 Ecuador
-
 Egypt
-
 El Salvador
-
 Estonia
-
 Eswatini
-
 Ethiopia
-
 Finland
-
 France
-
 Georgia
-
 Germany
-
 Ghana
-
 Greece
-
 Haiti
-
 Hong Kong
-
 Hungary
-
 India
-
 Indonesia
-
 Iran, Islamic republic
-
 Iraq
-
 Ireland
-
 Israel
-
 Italy
-
 Jamaica
-
 Japan
-
 Jordan
-
 Kazakhstan
-
 Kenya
-
 Korea
-
 Kuwait
-
 Kyrgyzstan
-
 Laos
-
 Latvia
-
 Lebanon
-
 Lesotho
-
 Libya
-
 Lithuania
-
 Luxembourg
-
 Madagascar
-
 Malaysia
-
 Malta
-
 Mauritius
-
 Mexico
-
 Moldova
-
 Mongolia
-
 Montenegro
-
 Morocco
-
 Mozambique
-
 Myanmar
-
 Namibia
-
 Nepal
-
 Netherlands
-
 New Zealand
-
 Nigeria
-
 North Macedonia
-
 Norway
-
 Oman
-
 Pakistan
-
 Palestine
-
 Panama
-
 Papua New Guinea
-
 Paraguay
-
 Peru
-
 Philippines
-
 Poland
-
 Portugal
-
 Puerto Rico
-
 Qatar
-
 Reunion
-
 Romania
-
 Rwanda
-
 Saudi Arabia
-
 Serbia
-
 Singapore
-
 Slovakia
-
 Slovenia
-
 Somalia
-
 South Africa
-
 Spain
-
 Sri Lanka
-
 Sweden
-
 Switzerland
-
 Syria
-
 Taiwan
-
 Tajikistan
-
 Tanzania
-
 Thailand
-
 Trinidad and Tobago
-
 Tunisia
-
 Turkey
-
 UAE
-
 Uganda
-
 Ukraine
-
 United Kingdom
-
United States
-
 Uruguay
-
 Uzbekistan
-
 Venezuela
-
 Vietnam
-
 Yemen
-
 Zambia
-
 Zimbabwe
- Forex
- Crypto












