

Will MSTR avoid further downside amid ongoing seller dominance?

Strategy (MSTR, formerly MicroStrategy) stock is trading at $99.42, having declined 3.41% on the day. The share price sits below its key moving averages, reflecting ongoing bearish momentum.
 103.76
124.08
Highlights
- Strategy purchased 485 bitcoin for approximately $33.4 million from November 9 to November 15, 2026, expanding its digital asset holdings.
- This acquisition increases the company’s sensitivity to bitcoin price swings as it continues to use crypto for treasury reserves.
- Shares of Strategy trade below major moving averages with strong bearish technical signals and an expected range of $89.51 to $109.33.
Balance sheet risk grows as bitcoin allocation expands
On November 16, 2026, Strategy disclosed in a Form 8-K that it purchased 485 bitcoin for approximately $33.4 million between November 9 and November 15, 2026, at an average price of $68,887 per bitcoin, according to Investing.com. This direct capital allocation into bitcoin expands the company's balance sheet exposure to digital assets and heightens its sensitivity to crypto market volatility. The timing and size of the acquisition reinforce the company's ongoing strategy of incorporating bitcoin as a corporate treasury reserve, though price action has remained under broader selling pressure.
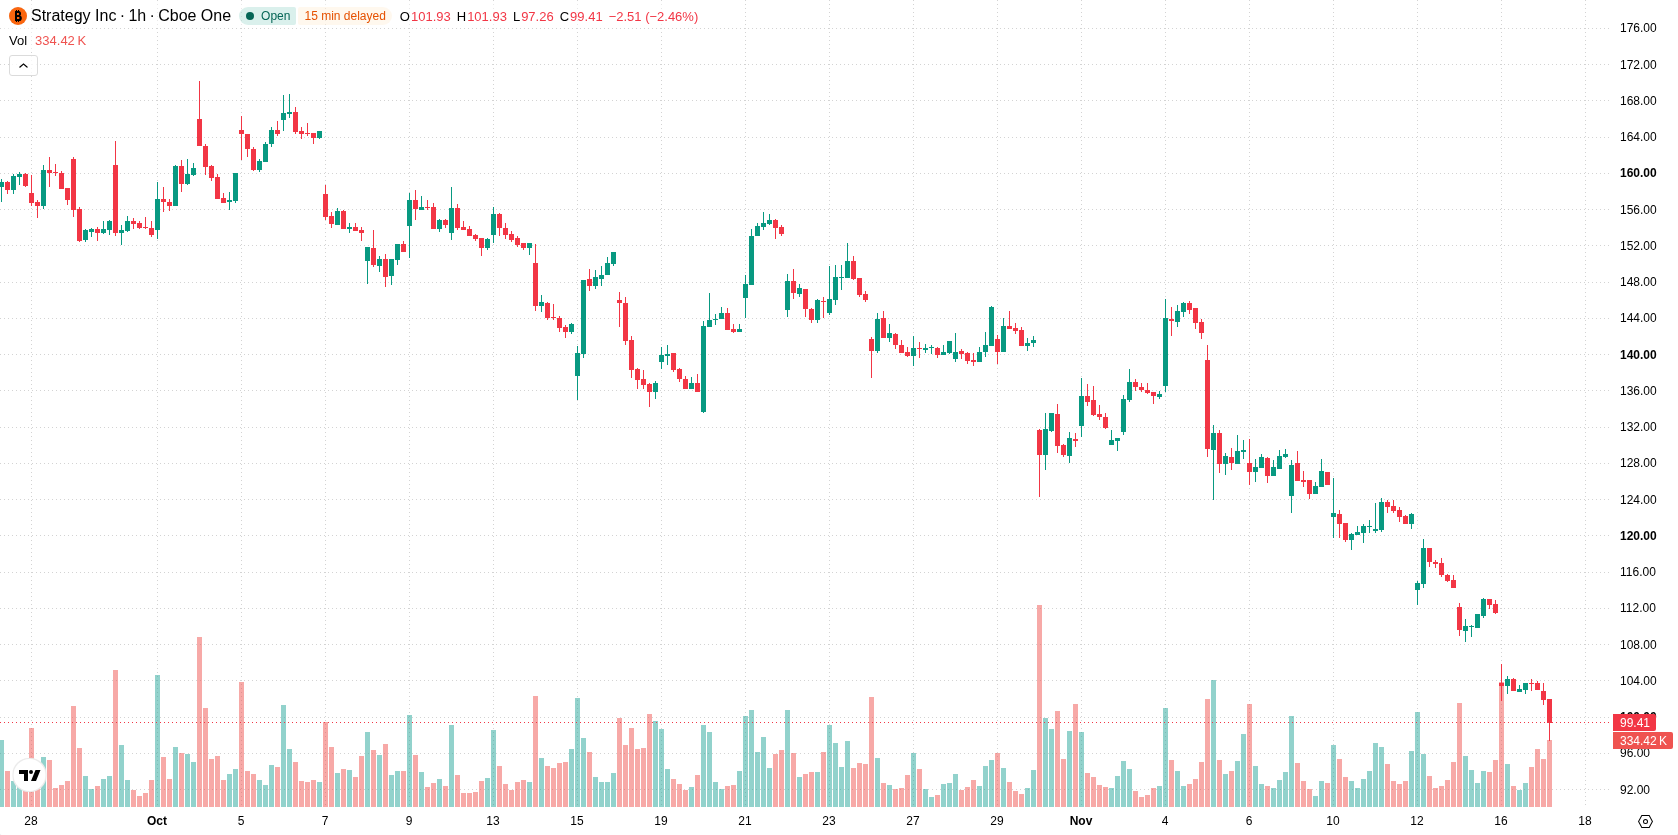
Bearish bias holds as oversold momentum meets resistance
The price remains below the H1 SMA-20 at $109.99, H1 SMA-50 at $118.48, and D1 SMA-200 at $132.54. The Ichimoku Kijun level at $112.82 is identified as immediate resistance. Momentum indicators confirm a bearish environment, with MACD and ADX signaling a prevailing sell bias. RSI stands in oversold territory at 26.25, and Stochastic RSI is similarly oversold at 18.15, suggesting potential selling exhaustion. CCI is neutral, while Bull/Bear Power at -3.08 shows sellers maintain intraday control. The Awesome Oscillator is neutral, indicating mixed momentum signals overall.
Downside risk elevated as volatility contains recovery odds
Over the short term, trading is expected to remain volatile within a corridor from $89.51 to $109.33, consistent with the current volatility band relative to prevailing levels. The probability of upward price movement is very low, while further decline remains highly likely in the near term. A sustained recovery would require a decisive move above the $112.82 resistance. If support at $89.51 fails, a bearish scenario may develop, signaling additional downside risk.
Previously it was reported that Strategy shares were under sustained bearish momentum due to persistent technical weakness and company capital allocation actions increasing its exposure to bitcoin. The current article reaffirms this prevailing downside scenario, highlighting the importance of monitoring the $89.51 support level as a potential inflection point for further risk.









-
 Afghanistan
-
 Albania
-
 Algeria
-
 Angola
-
 Argentina
-
 Armenia
-
 Australia
-
 Austria
-
 Azerbaijan
-
 Bahamas
-
 Bahrain
-
 Bangladesh
-
 Belarus
-
 Belgium
-
 Bolivia
-
 Botswana
-
 Brazil
-
 Brunei
-
 Bulgaria
-
 Cambodia
-
 Cameroon
-
 Canada
-
 Chile
-
 China
-
 Colombia
-
 Congo
-
 Costa Rica
-
 Cote d'Ivoire
-
 Croatia
-
 Cuba
-
 Cyprus
-
 Czechia
-
 DR Congo
-
 Denmark
-
 Dominican Republic
-
 Ecuador
-
 Egypt
-
 El Salvador
-
 Estonia
-
 Eswatini
-
 Ethiopia
-
 Finland
-
 France
-
 Georgia
-
 Germany
-
 Ghana
-
 Greece
-
 Haiti
-
 Hong Kong
-
 Hungary
-
 India
-
 Indonesia
-
 Iran, Islamic republic
-
 Iraq
-
 Ireland
-
 Israel
-
 Italy
-
 Jamaica
-
 Japan
-
 Jordan
-
 Kazakhstan
-
 Kenya
-
 Korea
-
 Kuwait
-
 Kyrgyzstan
-
 Laos
-
 Latvia
-
 Lebanon
-
 Lesotho
-
 Libya
-
 Lithuania
-
 Luxembourg
-
 Madagascar
-
 Malaysia
-
 Malta
-
 Mauritius
-
 Mexico
-
 Moldova
-
 Mongolia
-
 Montenegro
-
 Morocco
-
 Mozambique
-
 Myanmar
-
 Namibia
-
 Nepal
-
 Netherlands
-
 New Zealand
-
 Nigeria
-
 North Macedonia
-
 Norway
-
 Oman
-
 Pakistan
-
 Palestine
-
 Panama
-
 Papua New Guinea
-
 Paraguay
-
 Peru
-
 Philippines
-
 Poland
-
 Portugal
-
 Puerto Rico
-
 Qatar
-
 Reunion
-
 Romania
-
 Rwanda
-
 Saudi Arabia
-
 Serbia
-
 Singapore
-
 Slovakia
-
 Slovenia
-
 Somalia
-
 South Africa
-
 Spain
-
 Sri Lanka
-
 Sweden
-
 Switzerland
-
 Syria
-
 Taiwan
-
 Tajikistan
-
 Tanzania
-
 Thailand
-
 Trinidad and Tobago
-
 Tunisia
-
 Turkey
-
 UAE
-
 Uganda
-
 Ukraine
-
 United Kingdom
-
United States
-
 Uruguay
-
 Uzbekistan
-
 Venezuela
-
 Vietnam
-
 Yemen
-
 Zambia
-
 Zimbabwe
- Forex
- Crypto












