


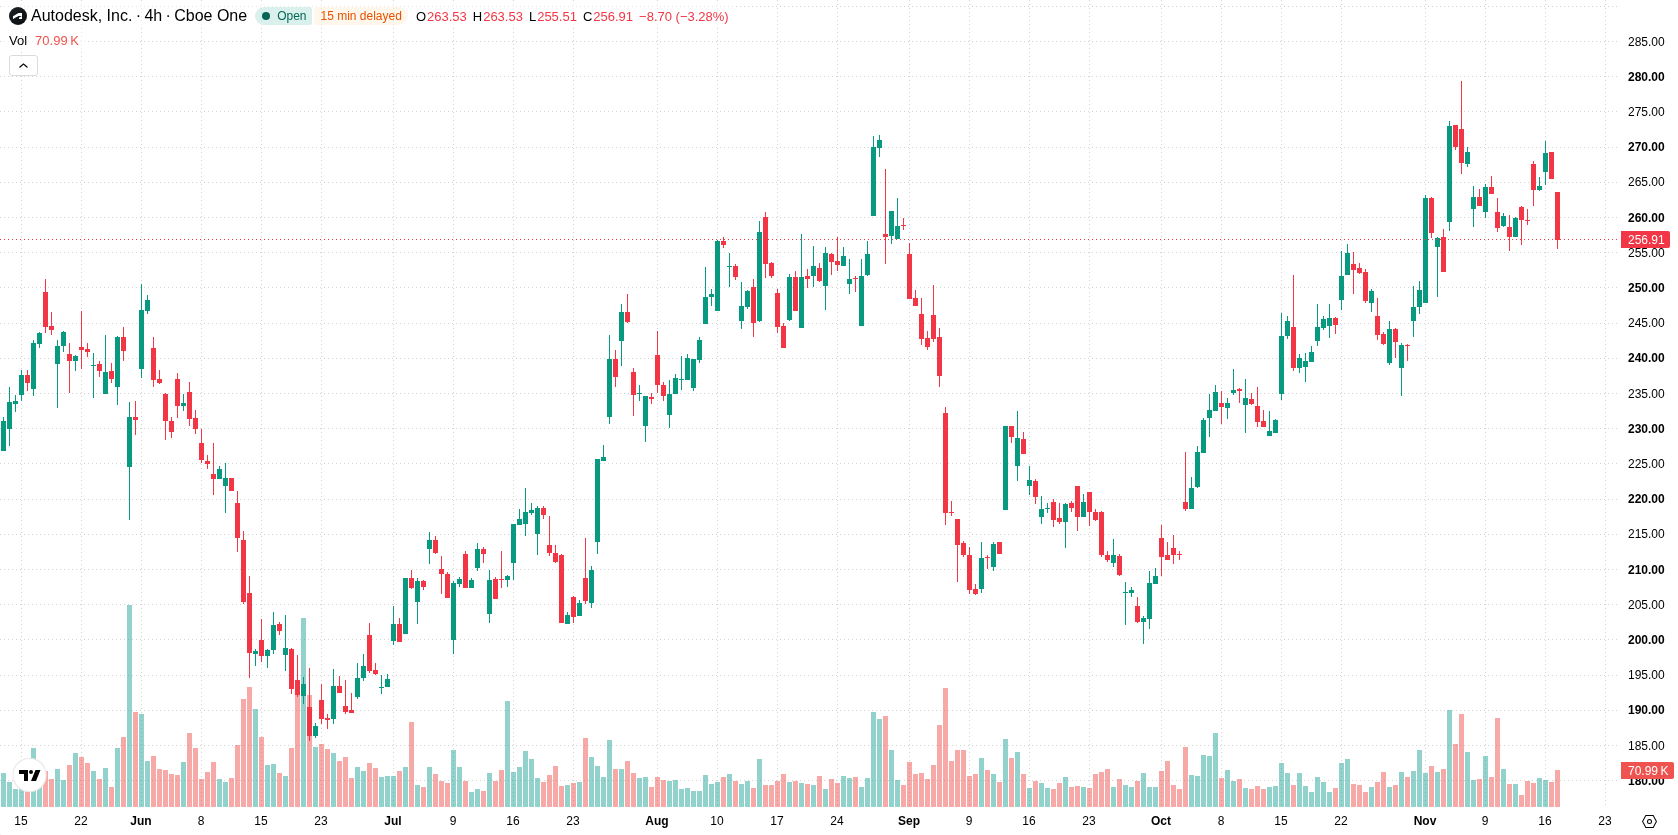
Autodesk Inc (ADSK) fell 3.35% amid selling pressure ahead of its scheduled Q3 2027 earnings release, with institutional position changes and recent billings and revenue growth forming the backdrop. The downside move contradicts the broader bullish technical setup, as the stock continues to trade above all key moving averages.
 262.20
270.77
Highlights
- Autodesk will report Q3 2027 earnings after market close on November 24, attracting increased institutional interest and position adjustments in the prior quarter.
- Fiscal Q2 2027 showed 10% billings growth and a 16% revenue increase, but Autodesk stock faced ongoing broad selling pressure.
- Shares of Autodesk are trading above key moving averages with bullish momentum, but intraday selling pushed the price near session lows; forecasts indicate a probable range of $248.87 to $267.28 over the next five days.
Institutional position shifts and recent growth impact pre-earnings sentiment
Autodesk is set to release its Q3 2027 earnings after market close on November 24. Recent filings indicated changes in institutional holdings during the third quarter, including new positions by Cetera Trust Company N.A and adjustments by other major holders. During fiscal Q2 2027, Autodesk reported 10% growth in billings and a 16% increase in revenue, though price action has remained under broader selling pressure.
Bullish technical structure faces correction risk amid intraday selling
Autodesk is trading above its short-, medium-, and long-term moving averages, with the price at $256.64 compared to the MA-20 at $255.53, MA-50 at $235.23, and MA-200 at $233.90. This configuration confirms a bullish structure on all timeframes, with the Ichimoku Kijun at $253.97 serving as support and near-term levels highlighted at $263.88 for resistance and $255.53 for support. Momentum indicators show the MACD and ADX both pointing to ongoing bullish trends. The RSI and Stochastic RSI are neutral, while the Commodity Channel Index (CCI) remains in the overbought zone, indicating a potential short-term correction risk. The Bull/Bear Power suggests buyers still control intraday momentum, and the Awesome Oscillator is neutral. The stock is priced near the daily low after an upside gap at the open, with volatility recorded at 2.63%. This intraday pattern highlights recent selling pressure offsetting prevailing bullish momentum.
Earlier, analysts noted that Autodesk benefited from industry re-rating and exhibited improving technical strength within the engineering software sector. The current configuration continues to support a bullish structural outlook, with the key upside risk centered on a potential break above $263.88 that could prompt a shift in momentum and volatility.











-
 Afghanistan
-
 Albania
-
 Algeria
-
 Angola
-
 Argentina
-
 Armenia
-
 Australia
-
 Austria
-
 Azerbaijan
-
 Bahamas
-
 Bahrain
-
 Bangladesh
-
 Belarus
-
 Belgium
-
 Bolivia
-
 Botswana
-
 Brazil
-
 Brunei
-
 Bulgaria
-
 Cambodia
-
 Cameroon
-
 Canada
-
 Chile
-
 China
-
 Colombia
-
 Congo
-
 Costa Rica
-
 Cote d'Ivoire
-
 Croatia
-
 Cuba
-
 Cyprus
-
 Czechia
-
 DR Congo
-
 Denmark
-
 Dominican Republic
-
 Ecuador
-
 Egypt
-
 El Salvador
-
 Estonia
-
 Eswatini
-
 Ethiopia
-
 Finland
-
 France
-
 Georgia
-
 Germany
-
 Ghana
-
 Greece
-
 Haiti
-
 Hong Kong
-
 Hungary
-
 India
-
 Indonesia
-
 Iran, Islamic republic
-
 Iraq
-
 Ireland
-
 Israel
-
 Italy
-
 Jamaica
-
 Japan
-
 Jordan
-
 Kazakhstan
-
 Kenya
-
 Korea
-
 Kuwait
-
 Kyrgyzstan
-
 Laos
-
 Latvia
-
 Lebanon
-
 Lesotho
-
 Libya
-
 Lithuania
-
 Luxembourg
-
 Madagascar
-
 Malaysia
-
 Malta
-
 Mauritius
-
 Mexico
-
 Moldova
-
 Mongolia
-
 Montenegro
-
 Morocco
-
 Mozambique
-
 Myanmar
-
 Namibia
-
 Nepal
-
 Netherlands
-
 New Zealand
-
 Nigeria
-
 North Macedonia
-
 Norway
-
 Oman
-
 Pakistan
-
 Palestine
-
 Panama
-
 Papua New Guinea
-
 Paraguay
-
 Peru
-
 Philippines
-
 Poland
-
 Portugal
-
 Puerto Rico
-
 Qatar
-
 Reunion
-
 Romania
-
 Rwanda
-
 Saudi Arabia
-
 Serbia
-
 Singapore
-
 Slovakia
-
 Slovenia
-
 Somalia
-
 South Africa
-
 Spain
-
 Sri Lanka
-
 Sweden
-
 Switzerland
-
 Syria
-
 Taiwan
-
 Tajikistan
-
 Tanzania
-
 Thailand
-
 Trinidad and Tobago
-
 Tunisia
-
 Turkey
-
 UAE
-
 Uganda
-
 Ukraine
-
 United Kingdom
-
United States
-
 Uruguay
-
 Uzbekistan
-
 Venezuela
-
 Vietnam
-
 Yemen
-
 Zambia
-
 Zimbabwe
- Forex
- Crypto












