


Affirm Holdings, Inc. (AFRM) fell 5.49% today, with ongoing insider selling and a significant stake reduction by Eurizon Capital weighing on sentiment. The decline is supported by AFRM remaining below its 20-, 50-, and 200-day moving averages, confirming persistent downside pressure.
 62.50
69.10
Highlights
- Eurizon Capital SGR S.p.A. cut its Affirm stock position by 44.8% in the third quarter.
- Recent filings show insider selling of Affirm shares, contributing to negative outlook on the stock.
- Affirm stock trades below key moving averages with downside momentum, expected to remain in the $54.99 to $62.78 range next week.
Stake reduction by Eurizon and insider sales drive bearish sentiment
Eurizon Capital SGR S.p.A. reduced its stake in Affirm by 44.8% during the third quarter. Insider selling was also reported in recent filings. These actions contributed to a negative sentiment around the stock.
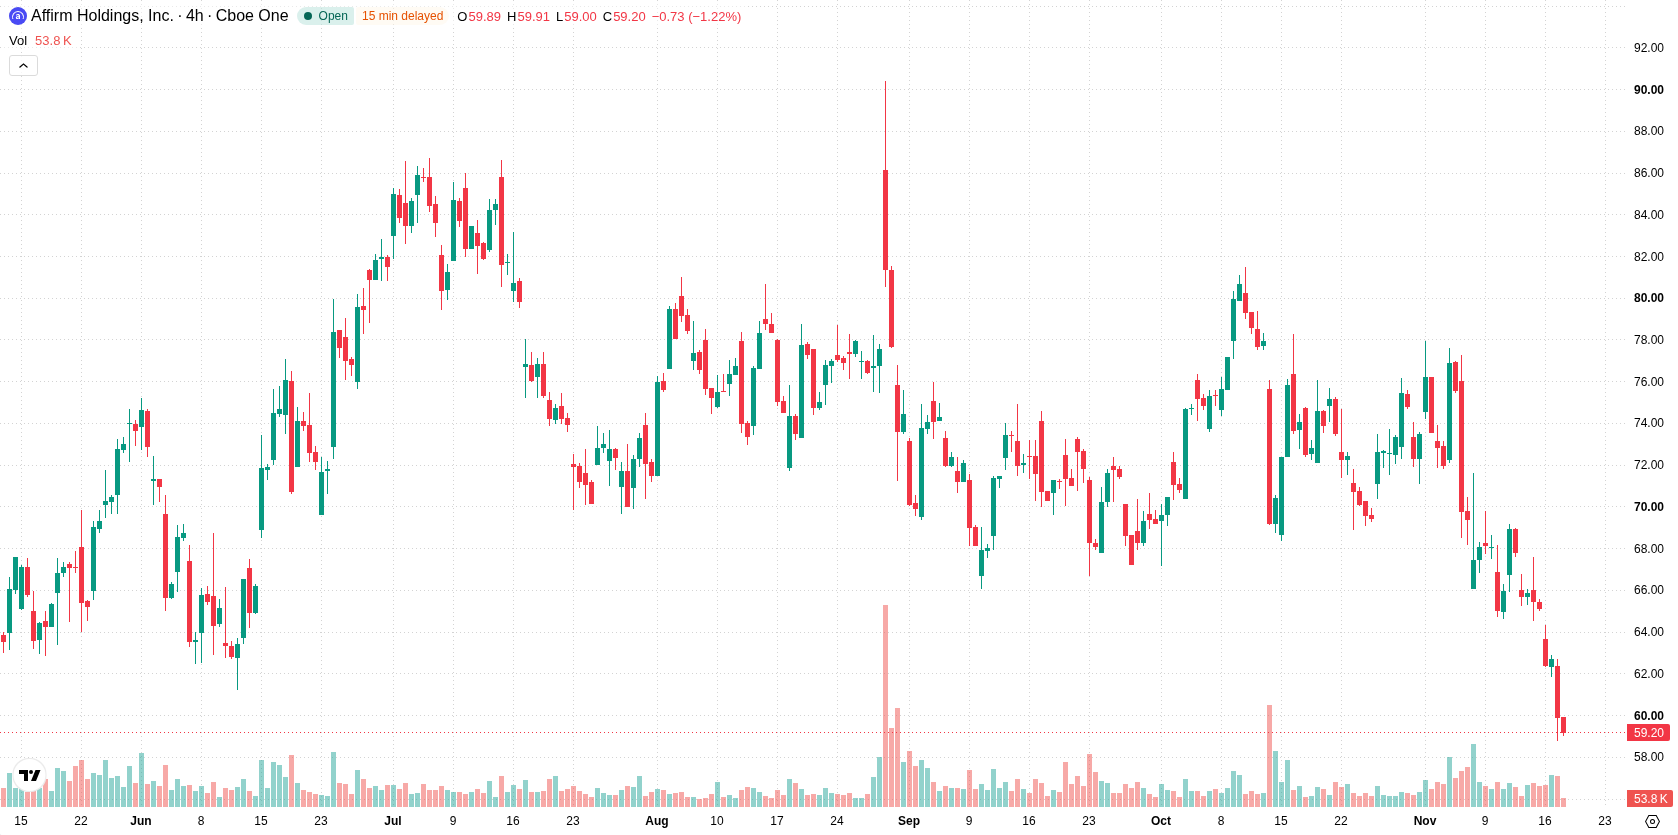
Support at $58.76 as oversold signals clash with persistent weakness
Affirm is trading below its 20-day, 50-day, and 200-day moving averages ($70.39, $71.59, and $66.5), indicating ongoing downside pressure across short-, medium-, and long-term timeframes. The nearest resistance is at $61.85, with initial support at $58.76. Momentum signals are mostly negative. The MACD favors selling and the ADX shows a weak trend. The RSI is neutral, while the Stochastic RSI and CCI are both in oversold zones, which points to selling exhaustion and a possible upside rebound risk. BBP is negative, showing sellers dominate intraday momentum. The current price of $59.16 has dropped $3.43 or 5.49% today after a downside gap and is trading near the session low. Intraday volatility stands at 6.36%. Price action and momentum remain aligned to the downside.
Earlier, analysts noted that Affirm faced persistent downside risk amid ongoing technical weakness and insider selling. The current analysis reinforces this negative outlook, highlighting the need for traders to monitor the $54.99 support level for signs of a potential breakdown.










-
 Afghanistan
-
 Albania
-
 Algeria
-
 Angola
-
 Argentina
-
 Armenia
-
 Australia
-
 Austria
-
 Azerbaijan
-
 Bahamas
-
 Bahrain
-
 Bangladesh
-
 Belarus
-
 Belgium
-
 Bolivia
-
 Botswana
-
 Brazil
-
 Brunei
-
 Bulgaria
-
 Cambodia
-
 Cameroon
-
 Canada
-
 Chile
-
 China
-
 Colombia
-
 Congo
-
 Costa Rica
-
 Cote d'Ivoire
-
 Croatia
-
 Cuba
-
 Cyprus
-
 Czechia
-
 DR Congo
-
 Denmark
-
 Dominican Republic
-
 Ecuador
-
 Egypt
-
 El Salvador
-
 Estonia
-
 Eswatini
-
 Ethiopia
-
 Finland
-
 France
-
 Georgia
-
 Germany
-
 Ghana
-
 Greece
-
 Haiti
-
 Hong Kong
-
 Hungary
-
 India
-
 Indonesia
-
 Iran, Islamic republic
-
 Iraq
-
 Ireland
-
 Israel
-
 Italy
-
 Jamaica
-
 Japan
-
 Jordan
-
 Kazakhstan
-
 Kenya
-
 Korea
-
 Kuwait
-
 Kyrgyzstan
-
 Laos
-
 Latvia
-
 Lebanon
-
 Lesotho
-
 Libya
-
 Lithuania
-
 Luxembourg
-
 Madagascar
-
 Malaysia
-
 Malta
-
 Mauritius
-
 Mexico
-
 Moldova
-
 Mongolia
-
 Montenegro
-
 Morocco
-
 Mozambique
-
 Myanmar
-
 Namibia
-
 Nepal
-
 Netherlands
-
 New Zealand
-
 Nigeria
-
 North Macedonia
-
 Norway
-
 Oman
-
 Pakistan
-
 Palestine
-
 Panama
-
 Papua New Guinea
-
 Paraguay
-
 Peru
-
 Philippines
-
 Poland
-
 Portugal
-
 Puerto Rico
-
 Qatar
-
 Reunion
-
 Romania
-
 Rwanda
-
 Saudi Arabia
-
 Serbia
-
 Singapore
-
 Slovakia
-
 Slovenia
-
 Somalia
-
 South Africa
-
 Spain
-
 Sri Lanka
-
 Sweden
-
 Switzerland
-
 Syria
-
 Taiwan
-
 Tajikistan
-
 Tanzania
-
 Thailand
-
 Trinidad and Tobago
-
 Tunisia
-
 Turkey
-
 UAE
-
 Uganda
-
 Ukraine
-
 United Kingdom
-
United States
-
 Uruguay
-
 Uzbekistan
-
 Venezuela
-
 Vietnam
-
 Yemen
-
 Zambia
-
 Zimbabwe
- Forex
- Crypto












