

Will HSBC stock hold above GBX1,299 support as downside risks increase?

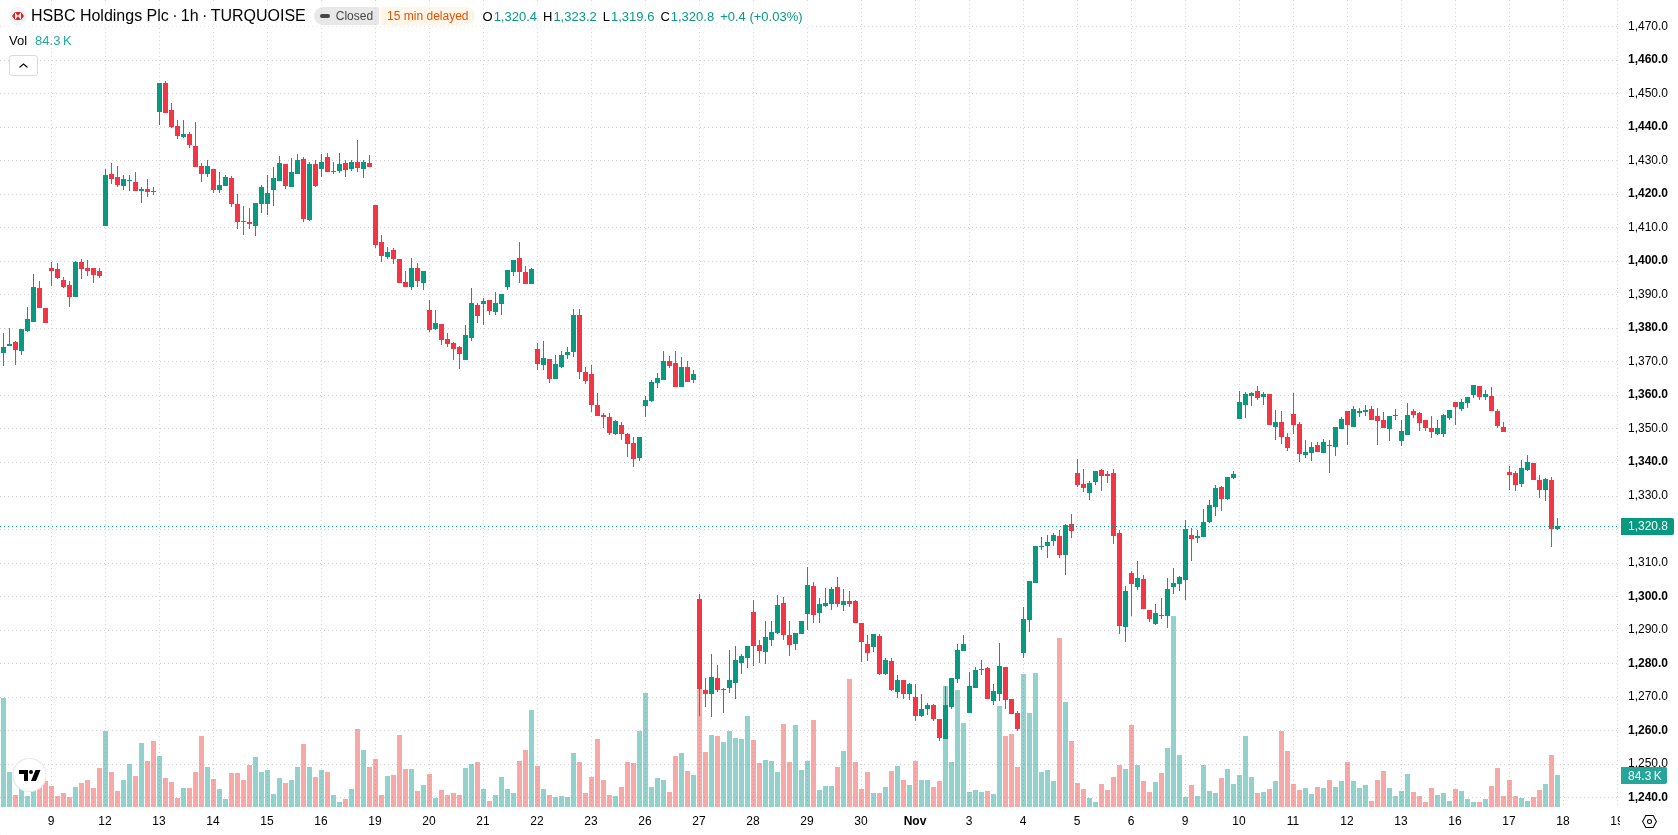
HSBC (HSBA.L) stock is trading at GBX1,320.8, down 1.95% on the day. The price remains below its key moving averages, indicating continued short-term and long-term pressure.
 1346.80
1363.20
Highlights
- HSBC cancelled 1,010,000 ordinary shares on November 17, 2026 as part of its ongoing buy-back programme, reducing the outstanding share count.
- The company has spent approximately US$228.4 million repurchasing over 13 million shares since late October, with Hong Kong cancellations pending.
- Shares of HSBC trade below key moving averages with sell signals across multiple indicators, and price is expected to remain under pressure in the GBX1,299 to GBX1,334 range in the near term.
Share cancellations support metrics as broader price slump prevails
HSBC (HSBA.L) cancelled 1,010,000 ordinary shares on November 17, 2026 as part of its ongoing buy-back programme, a move that reduces the outstanding share count and directly supports per-share metrics. Since launching the buy-back in late October, the company has repurchased over 13 million shares with an aggregate expenditure of approximately US$228.4 million. According to Investegate Co, these actions adjust HSBC (HSBA.L)'s issued ordinary share capital to 17,122,144,446 following the UK transactions, with Hong Kong cancellations still awaiting finalization. The programme's supportive effect is clear, though price action has remained under broader selling pressure.
Multiple bearish momentum signals as technical boundaries cap rebounds
The price of HSBC (HSBA.L) is trading below the H1 SMA-20 at GBX1,345, the H1 SMA-50 at GBX1,348, and the D1 SMA-200 at GBX1,392. Immediate resistance is now defined by the Ichimoku Kijun at GBX1,338. Momentum indicators remain firmly negative, with both MACD and ADX showing sell signals. RSI, Stochastic RSI, and CCI are all at oversold levels, suggesting that downside conditions are stretched but without a confirmed reversal. Bull/Bear Power registers at -2.33, reflecting intraday dominance by sellers, while the Awesome Oscillator also aligns with prevailing bearish momentum.
Elevated downside risk persists without signs of short-term reversal
Short-term price action for HSBC (HSBA.L) is likely to remain within the GBX1,299 to GBX1,334 range, defining a typical volatility band relative to current levels. The probability of an upward move remains very low, while the risk of continued decline is significantly elevated. A sustained close below GBX1,299 would signal further selling pressure, while a move above the Ichimoku Kijun at GBX1,338 would be the first indication of potential stabilization or recovery.
Previously it was reported that HSBC maintained a cautious outlook due to subdued technical momentum reinforced by ongoing share buybacks and risk management actions. The current article strengthens this assessment, as fresh downside acceleration and continued pressure below moving averages make a decisive move below GBX1,299 the next critical risk for traders to monitor.









-
 Afghanistan
-
 Albania
-
 Algeria
-
 Angola
-
 Argentina
-
 Armenia
-
 Australia
-
 Austria
-
 Azerbaijan
-
 Bahamas
-
 Bahrain
-
 Bangladesh
-
 Belarus
-
 Belgium
-
 Bolivia
-
 Botswana
-
 Brazil
-
 Brunei
-
 Bulgaria
-
 Cambodia
-
 Cameroon
-
 Canada
-
 Chile
-
 China
-
 Colombia
-
 Congo
-
 Costa Rica
-
 Cote d'Ivoire
-
 Croatia
-
 Cuba
-
 Cyprus
-
 Czechia
-
 DR Congo
-
 Denmark
-
 Dominican Republic
-
 Ecuador
-
 Egypt
-
 El Salvador
-
 Estonia
-
 Eswatini
-
 Ethiopia
-
 Finland
-
 France
-
 Georgia
-
 Germany
-
 Ghana
-
 Greece
-
 Haiti
-
 Hong Kong
-
 Hungary
-
 India
-
 Indonesia
-
 Iran, Islamic republic
-
 Iraq
-
 Ireland
-
 Israel
-
 Italy
-
 Jamaica
-
 Japan
-
 Jordan
-
 Kazakhstan
-
 Kenya
-
 Korea
-
 Kuwait
-
 Kyrgyzstan
-
 Laos
-
 Latvia
-
 Lebanon
-
 Lesotho
-
 Libya
-
 Lithuania
-
 Luxembourg
-
 Madagascar
-
 Malaysia
-
 Malta
-
 Mauritius
-
 Mexico
-
 Moldova
-
 Mongolia
-
 Montenegro
-
 Morocco
-
 Mozambique
-
 Myanmar
-
 Namibia
-
 Nepal
-
 Netherlands
-
 New Zealand
-
 Nigeria
-
 North Macedonia
-
 Norway
-
 Oman
-
 Pakistan
-
 Palestine
-
 Panama
-
 Papua New Guinea
-
 Paraguay
-
 Peru
-
 Philippines
-
 Poland
-
 Portugal
-
 Puerto Rico
-
 Qatar
-
 Reunion
-
 Romania
-
 Rwanda
-
 Saudi Arabia
-
 Serbia
-
 Singapore
-
 Slovakia
-
 Slovenia
-
 Somalia
-
 South Africa
-
 Spain
-
 Sri Lanka
-
 Sweden
-
 Switzerland
-
 Syria
-
 Taiwan
-
 Tajikistan
-
 Tanzania
-
 Thailand
-
 Trinidad and Tobago
-
 Tunisia
-
 Turkey
-
 UAE
-
 Uganda
-
 Ukraine
-
 United Kingdom
-
United States
-
 Uruguay
-
 Uzbekistan
-
 Venezuela
-
 Vietnam
-
 Yemen
-
 Zambia
-
 Zimbabwe
- Forex
- Crypto












