

NNDM trades flat as prevailing seller pressure keeps upward breakout in check

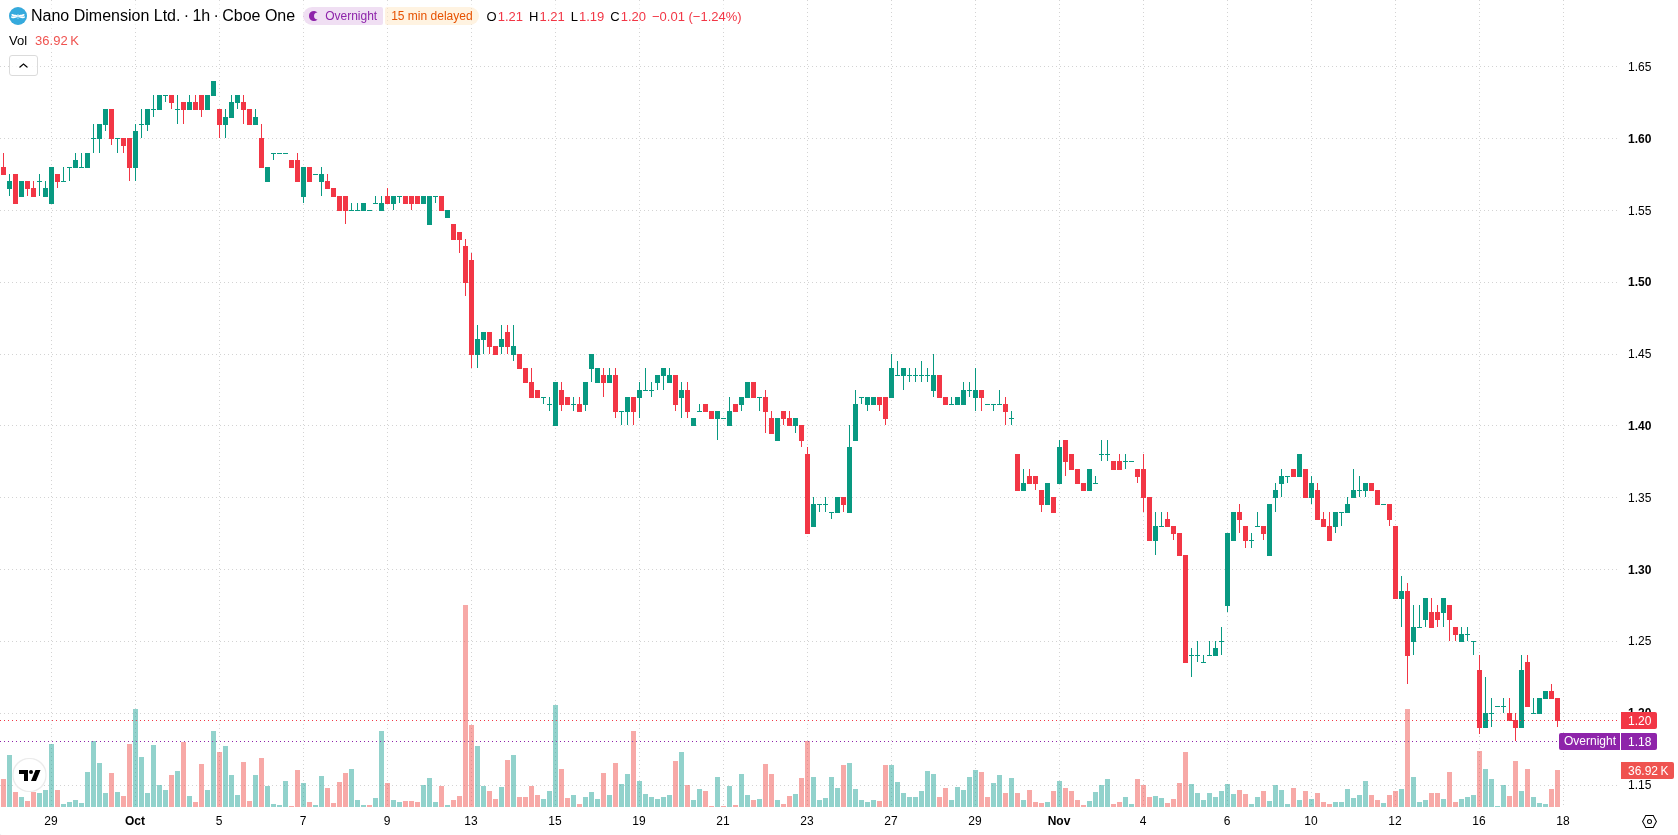
Nano Dimension (NNDM) stock is trading at $1.19 after a marginal gain today. The price remains below its key moving averages, signaling continued caution among traders.
 1.25
1.33
Highlights
- NNDM/USD trades below key moving averages across multiple timeframes, confirming sustained bearish momentum in the short term.
- Technical signals such as MACD and ADX show strong sell pressure, while volatility remains elevated and intraday price stays near session lows.
- The expected trading range for the next several days is $1.11 to $1.27, with a high probability of downward movement unless immediate resistance breaks.
Weak intraday momentum as technical signals remain bearish
On the technical front, NNDM trades below the H1 SMA-20 at $1.22, the H1 SMA-50 at $1.29, and the D1 SMA-200 at $1.6. The Ichimoku Kijun at $1.23 stands as immediate resistance for the current price. MACD confirms a strong sell signal, while ADX also points to a prevailing sell trend. RSI, Stochastic RSI, and CCI all register neutral readings, giving no clear indication of extreme market conditions. Bull/Bear Power is just above zero, indicating a slightly cautious buyer presence. Despite high volatility and an intraday gap up of $0.02, the stock remains near the lower end of today's price range, keeping the intraday momentum weak.
Sideways outlook as downside risk overshadows breakout hopes
In the short term, the anticipated trading range for NNDM is between $1.11 and $1.27, reflecting the typical volatility band relative to current levels. The probability of a move higher is low, while downside risk remains elevated. Baseline expectations point to sideways action within this corridor, with a bullish breakout requiring a clear move above immediate resistance. If support near the range's lower boundary fails, a bearish scenario could quickly develop toward $1.11.
Earlier, analysts noted that Nano Dimension continued to face persistent downside risk and a bearish technical outlook following its recent structural changes. Current technical signals confirm this stance, highlighting the importance of the $1.11 support level as a key threshold for potential further downside movement.






Latest Nano Dimension News




-
 Afghanistan
-
 Albania
-
 Algeria
-
 Angola
-
 Argentina
-
 Armenia
-
 Australia
-
 Austria
-
 Azerbaijan
-
 Bahamas
-
 Bahrain
-
 Bangladesh
-
 Belarus
-
 Belgium
-
 Bolivia
-
 Botswana
-
 Brazil
-
 Brunei
-
 Bulgaria
-
 Cambodia
-
 Cameroon
-
 Canada
-
 Chile
-
 China
-
 Colombia
-
 Congo
-
 Costa Rica
-
 Cote d'Ivoire
-
 Croatia
-
 Cuba
-
 Cyprus
-
 Czechia
-
 DR Congo
-
 Denmark
-
 Dominican Republic
-
 Ecuador
-
 Egypt
-
 El Salvador
-
 Estonia
-
 Eswatini
-
 Ethiopia
-
 Finland
-
 France
-
 Georgia
-
 Germany
-
 Ghana
-
 Greece
-
 Haiti
-
 Hong Kong
-
 Hungary
-
 India
-
 Indonesia
-
 Iran, Islamic republic
-
 Iraq
-
 Ireland
-
 Israel
-
 Italy
-
 Jamaica
-
 Japan
-
 Jordan
-
 Kazakhstan
-
 Kenya
-
 Korea
-
 Kuwait
-
 Kyrgyzstan
-
 Laos
-
 Latvia
-
 Lebanon
-
 Lesotho
-
 Libya
-
 Lithuania
-
 Luxembourg
-
 Madagascar
-
 Malaysia
-
 Malta
-
 Mauritius
-
 Mexico
-
 Moldova
-
 Mongolia
-
 Montenegro
-
 Morocco
-
 Mozambique
-
 Myanmar
-
 Namibia
-
 Nepal
-
 Netherlands
-
 New Zealand
-
 Nigeria
-
 North Macedonia
-
 Norway
-
 Oman
-
 Pakistan
-
 Palestine
-
 Panama
-
 Papua New Guinea
-
 Paraguay
-
 Peru
-
 Philippines
-
 Poland
-
 Portugal
-
 Puerto Rico
-
 Qatar
-
 Reunion
-
 Romania
-
 Rwanda
-
 Saudi Arabia
-
 Serbia
-
 Singapore
-
 Slovakia
-
 Slovenia
-
 Somalia
-
 South Africa
-
 Spain
-
 Sri Lanka
-
 Sweden
-
 Switzerland
-
 Syria
-
 Taiwan
-
 Tajikistan
-
 Tanzania
-
 Thailand
-
 Trinidad and Tobago
-
 Tunisia
-
 Turkey
-
 UAE
-
 Uganda
-
 Ukraine
-
 United Kingdom
-
United States
-
 Uruguay
-
 Uzbekistan
-
 Venezuela
-
 Vietnam
-
 Yemen
-
 Zambia
-
 Zimbabwe
- Forex
- Crypto












