

Will Nano Dimension stock hold $1.11 support amid persistent downward price move?

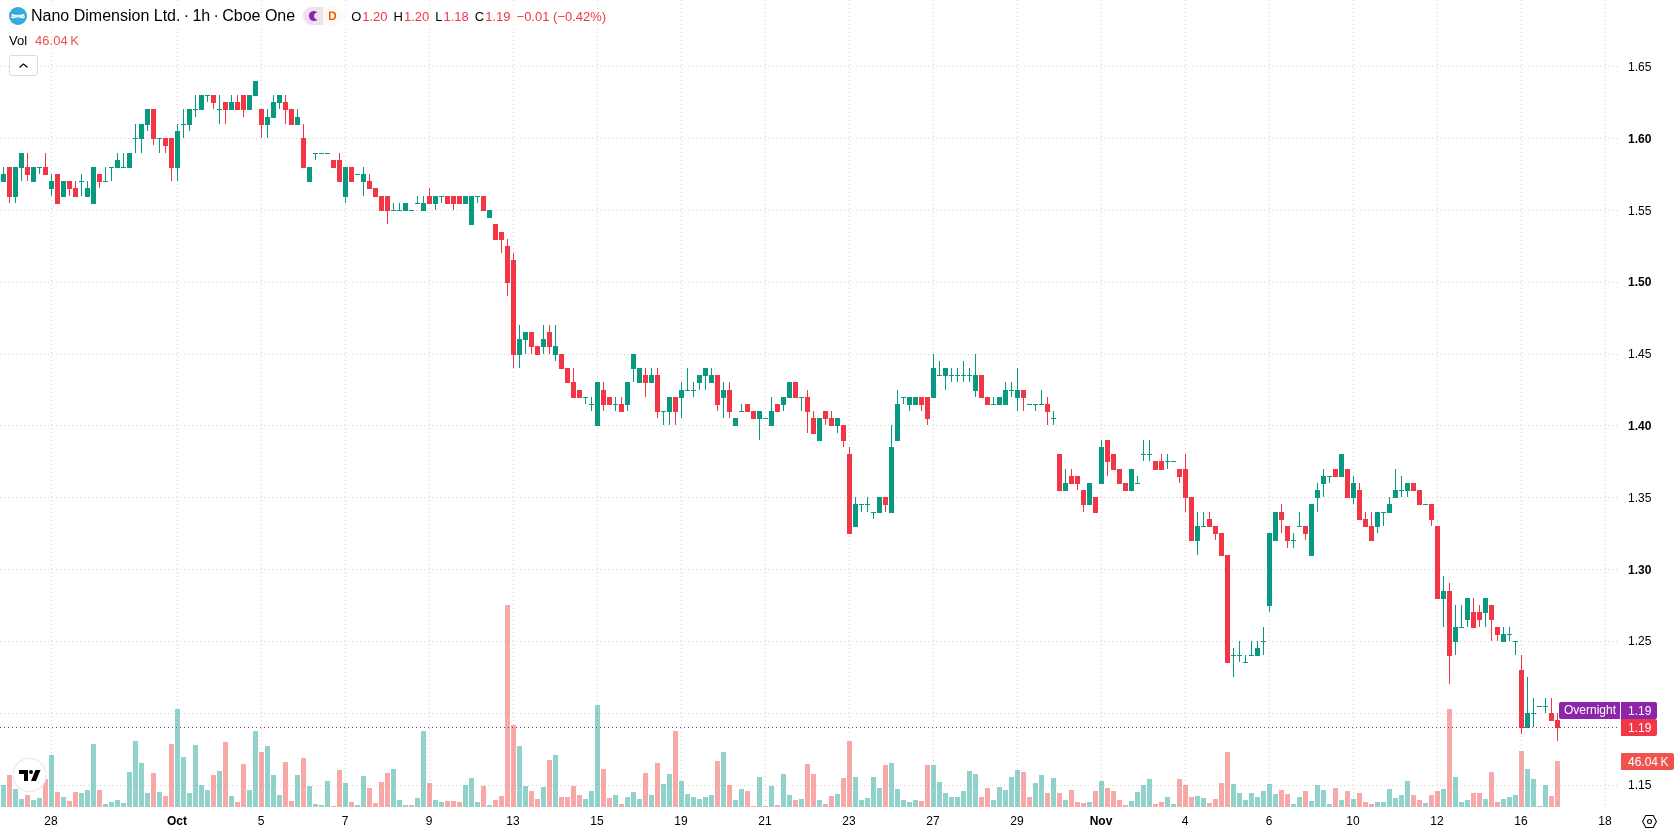
Nano Dimension (NNDM) stock is trading at $1.19, having declined 4.42% today. The price remains below its key moving averages, reflecting persistent downward momentum in the short and long term.
 1.24
1.37
Highlights
- Nano Dimension completed the sale of its Global Inkjet Systems business to QTREX Quantum for $16 million in equity assets.
- The transaction brings QTREX equity instruments and greater financial flexibility but removes an operating subsidiary from Nano Dimension's revenue base.
- Shares of Nano Dimension traded at $1.19, down 4.42% amid bearish momentum with high probability of further decline to $1.11 to $1.27.
Financial flexibility grows while near-term sentiment pressured by asset sale
Nano Dimension has finalized the sale of its Global Inkjet Systems business to QTREX Quantum in a $16 million equity transaction, as reported by Stockhouse. The deal provides Nano Dimension with QTREX equity instruments, including ordinary shares, pre-funded warrants, and additional warrants exercisable above market at $1.21 per share. While this transaction supplies the company with additional liquid assets and increases its financial flexibility, it also removes an operating subsidiary from revenue streams, which may weigh on near-term sentiment in the absence of immediate cash inflow.
Bearish momentum persists as mixed signals temper reversal outlook
On the technical side, NNDM is trading below the H1 SMA-20 at $1.24, the H1 SMA-50 at $1.3, and the D1 SMA-200 at $1.61. The Ichimoku Kijun at $1.27 serves as immediate resistance and a potential turning point if the stock stages an upside attempt. Momentum indicators present a cautious outlook: MACD and ADX both signal Sell, while Bull/Bear Power remains negative, pointing to seller dominance. RSI and CCI are in the oversold zone, suggesting potential selling exhaustion, whereas the Stochastic RSI is neutral and the Awesome Oscillator does not provide a clear trend bias. The collective readings indicate mixed signals for a short-term reversal, with prevailing bias cautious due to strong downside momentum but some signs of selling fatigue.
High risk of further losses as support threatens to give way
Over the next several sessions, NNDM is expected to fluctuate within a volatility band between $1.11 and $1.27. A very low probability is assigned to an upward move, while the likelihood of continued decline is high if support is lost. Persistence above current levels may lead to further consolidation; a break above $1.27 could ignite a shift to bullish sentiment, while a drop below $1.11 would likely accelerate further downside momentum.
Earlier, analysts noted that Nano Dimension faced persistent downside risk following the sale of its subsidiary and sustained weakness below major moving averages. The current analysis reinforces this bearish outlook, highlighting the importance of monitoring the $1.11 support level for signs of either further downside acceleration or potential stabilization.






Latest Nano Dimension News




-
 Afghanistan
-
 Albania
-
 Algeria
-
 Angola
-
 Argentina
-
 Armenia
-
 Australia
-
 Austria
-
 Azerbaijan
-
 Bahamas
-
 Bahrain
-
 Bangladesh
-
 Belarus
-
 Belgium
-
 Bolivia
-
 Botswana
-
 Brazil
-
 Brunei
-
 Bulgaria
-
 Cambodia
-
 Cameroon
-
 Canada
-
 Chile
-
 China
-
 Colombia
-
 Congo
-
 Costa Rica
-
 Cote d'Ivoire
-
 Croatia
-
 Cuba
-
 Cyprus
-
 Czechia
-
 DR Congo
-
 Denmark
-
 Dominican Republic
-
 Ecuador
-
 Egypt
-
 El Salvador
-
 Estonia
-
 Eswatini
-
 Ethiopia
-
 Finland
-
 France
-
 Georgia
-
 Germany
-
 Ghana
-
 Greece
-
 Haiti
-
 Hong Kong
-
 Hungary
-
 India
-
 Indonesia
-
 Iran, Islamic republic
-
 Iraq
-
 Ireland
-
 Israel
-
 Italy
-
 Jamaica
-
 Japan
-
 Jordan
-
 Kazakhstan
-
 Kenya
-
 Korea
-
 Kuwait
-
 Kyrgyzstan
-
 Laos
-
 Latvia
-
 Lebanon
-
 Lesotho
-
 Libya
-
 Lithuania
-
 Luxembourg
-
 Madagascar
-
 Malaysia
-
 Malta
-
 Mauritius
-
 Mexico
-
 Moldova
-
 Mongolia
-
 Montenegro
-
 Morocco
-
 Mozambique
-
 Myanmar
-
 Namibia
-
 Nepal
-
 Netherlands
-
 New Zealand
-
 Nigeria
-
 North Macedonia
-
 Norway
-
 Oman
-
 Pakistan
-
 Palestine
-
 Panama
-
 Papua New Guinea
-
 Paraguay
-
 Peru
-
 Philippines
-
 Poland
-
 Portugal
-
 Puerto Rico
-
 Qatar
-
 Reunion
-
 Romania
-
 Rwanda
-
 Saudi Arabia
-
 Serbia
-
 Singapore
-
 Slovakia
-
 Slovenia
-
 Somalia
-
 South Africa
-
 Spain
-
 Sri Lanka
-
 Sweden
-
 Switzerland
-
 Syria
-
 Taiwan
-
 Tajikistan
-
 Tanzania
-
 Thailand
-
 Trinidad and Tobago
-
 Tunisia
-
 Turkey
-
 UAE
-
 Uganda
-
 Ukraine
-
 United Kingdom
-
United States
-
 Uruguay
-
 Uzbekistan
-
 Venezuela
-
 Vietnam
-
 Yemen
-
 Zambia
-
 Zimbabwe
- Forex
- Crypto












