

What's behind Vodafone's latest 1.7% stock pullback?

Vodafone Group Plc (VOD) slipped 1.68% as the market reacted to amendments in the company’s capital securities and large reported net losses, even as the interim dividend was raised. The move is supported by continued downside pressure, with Vodafone trading below all its key moving averages and facing persistent selling momentum.
 115.95
119.20
Highlights
- Vodafone recorded a 5.8% increase in organic service revenue and a 6.4% rise in adjusted EBITDAaL for the first half, lifting full-year 2027 EBITDAaL and free cash flow guidance.
- The company faces an estimated €3.6 to €4.8 billion net loss for the period and may require €2.2 billion in equity funding for its German fibre joint venture.
- Shares of Vodafone closed at GBX114.2 after a 1.68% drop, with current downside momentum and an 80% probability of further declines within a GBX112.28 to GBX116.13 five-day range.
Net loss and equity funding needs offset revenue and dividend growth
Vodafone amended the terms of three capital-security series, including its US$2 billion notes maturing in 2079, to align subordination clauses and ensure equal ranking with other group securities. In its latest earnings, Vodafone recorded a 5.8% gain in organic service revenue and a 6.4% increase in adjusted EBITDAaL for the first half, and raised its full-year 2027 adjusted EBITDAaL and free cash flow guidance. The interim dividend was increased, but the period also saw a net loss estimated at €3.6–€4.8 billion, with a potential €2.2 billion equity funding requirement for its German fibre joint venture. Vodafone España, now under Zegona, reported a 2.9% year-on-year revenue rise, though price action has remained under broader selling pressure.
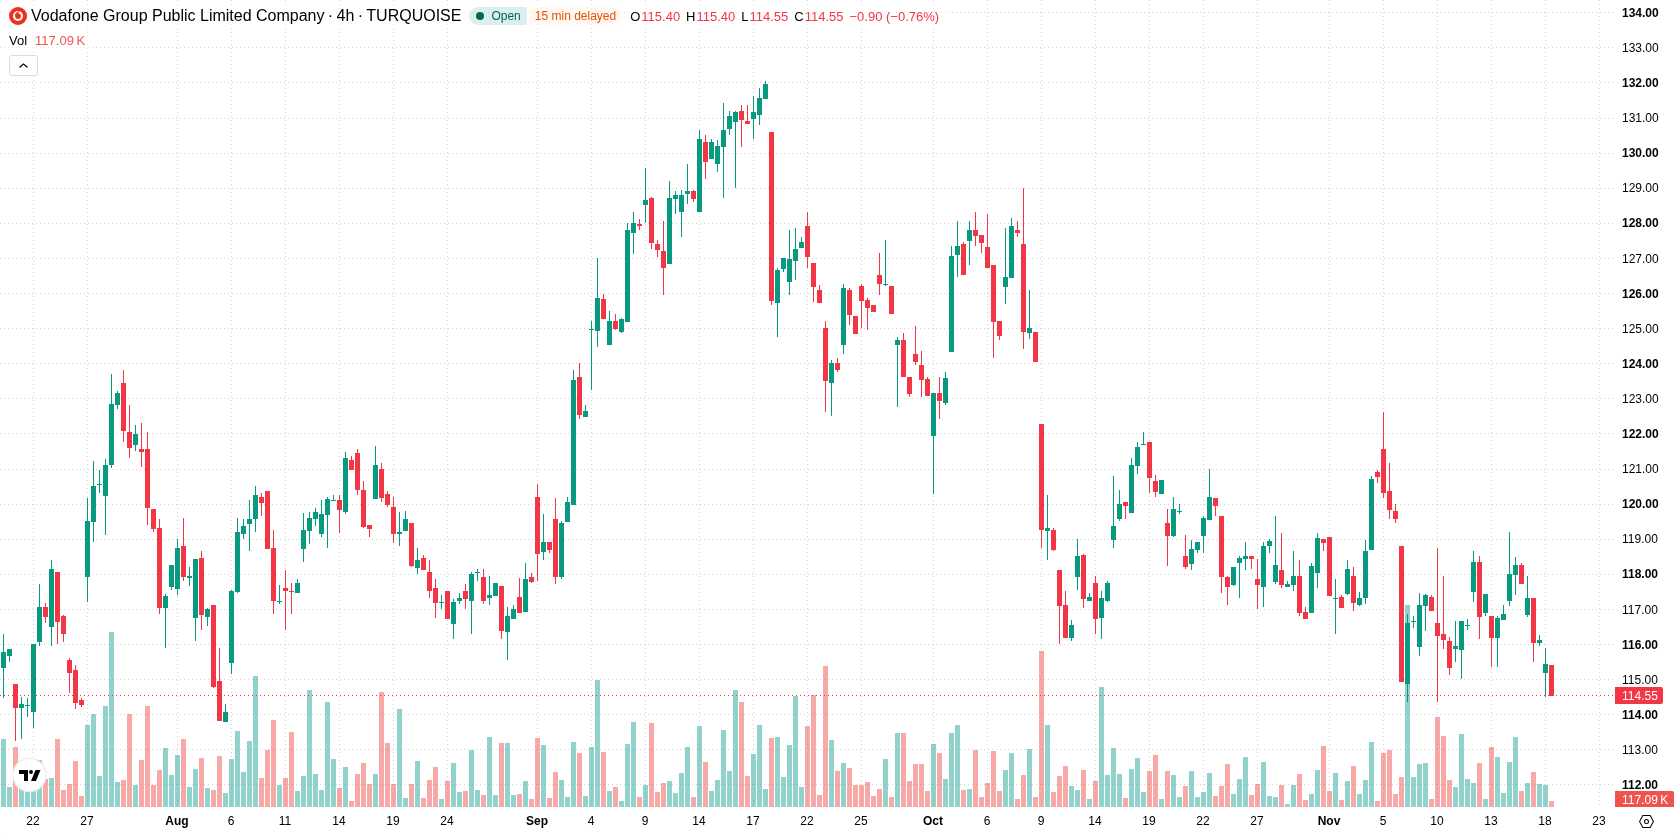
Persistent seller dominance as negative momentum eclipses bullish trend setup
Vodafone is trading below its 20-day (GBX117.8), 50-day (GBX121.95), and 200-day (GBX115.61) moving averages, highlighting ongoing seller dominance across all observed timeframes. Immediate technical levels are defined by resistance at GBX114.6 and support at GBX112.28. The longer-term trend backdrop is shaped by a bullish alignment between the 50- and 200-day averages, but this is currently outweighed by negative price momentum. Momentum indicators reflect strong selling pressure from the MACD, while the ADX, RSI, Stochastic RSI, and CCI all present neutral readings, suggesting the absence of extreme or oversold conditions. Bull/Bear Power (BBP) is slightly positive intraday, indicating minor buyer activity, though this has not reversed the overall bearish tone. Vodafone trades near the day's low with intraday volatility at 1.18% and shows consistent weakness after the open.
Previously it was reported that Vodafone’s technical outlook remained bearish following amendments to its capital securities, with analysts highlighting persistent selling pressure as a central risk factor. The current analysis strengthens this view, identifying continued downside momentum and flagging a move below GBX112.28 as a key signal for further weakness ahead.









-
 Afghanistan
-
 Albania
-
 Algeria
-
 Angola
-
 Argentina
-
 Armenia
-
 Australia
-
 Austria
-
 Azerbaijan
-
 Bahamas
-
 Bahrain
-
 Bangladesh
-
 Belarus
-
 Belgium
-
 Bolivia
-
 Botswana
-
 Brazil
-
 Brunei
-
 Bulgaria
-
 Cambodia
-
 Cameroon
-
 Canada
-
 Chile
-
 China
-
 Colombia
-
 Congo
-
 Costa Rica
-
 Cote d'Ivoire
-
 Croatia
-
 Cuba
-
 Cyprus
-
 Czechia
-
 DR Congo
-
 Denmark
-
 Dominican Republic
-
 Ecuador
-
 Egypt
-
 El Salvador
-
 Estonia
-
 Eswatini
-
 Ethiopia
-
 Finland
-
 France
-
 Georgia
-
 Germany
-
 Ghana
-
 Greece
-
 Haiti
-
 Hong Kong
-
 Hungary
-
 India
-
 Indonesia
-
 Iran, Islamic republic
-
 Iraq
-
 Ireland
-
 Israel
-
 Italy
-
 Jamaica
-
 Japan
-
 Jordan
-
 Kazakhstan
-
 Kenya
-
 Korea
-
 Kuwait
-
 Kyrgyzstan
-
 Laos
-
 Latvia
-
 Lebanon
-
 Lesotho
-
 Libya
-
 Lithuania
-
 Luxembourg
-
 Madagascar
-
 Malaysia
-
 Malta
-
 Mauritius
-
 Mexico
-
 Moldova
-
 Mongolia
-
 Montenegro
-
 Morocco
-
 Mozambique
-
 Myanmar
-
 Namibia
-
 Nepal
-
 Netherlands
-
 New Zealand
-
 Nigeria
-
 North Macedonia
-
 Norway
-
 Oman
-
 Pakistan
-
 Palestine
-
 Panama
-
 Papua New Guinea
-
 Paraguay
-
 Peru
-
 Philippines
-
 Poland
-
 Portugal
-
 Puerto Rico
-
 Qatar
-
 Reunion
-
 Romania
-
 Rwanda
-
 Saudi Arabia
-
 Serbia
-
 Singapore
-
 Slovakia
-
 Slovenia
-
 Somalia
-
 South Africa
-
 Spain
-
 Sri Lanka
-
 Sweden
-
 Switzerland
-
 Syria
-
 Taiwan
-
 Tajikistan
-
 Tanzania
-
 Thailand
-
 Trinidad and Tobago
-
 Tunisia
-
 Turkey
-
 UAE
-
 Uganda
-
 Ukraine
-
 United Kingdom
-
United States
-
 Uruguay
-
 Uzbekistan
-
 Venezuela
-
 Vietnam
-
 Yemen
-
 Zambia
-
 Zimbabwe
- Forex
- Crypto












