

Earnings beat and outlook upgrade boost Target stock amid upward price move

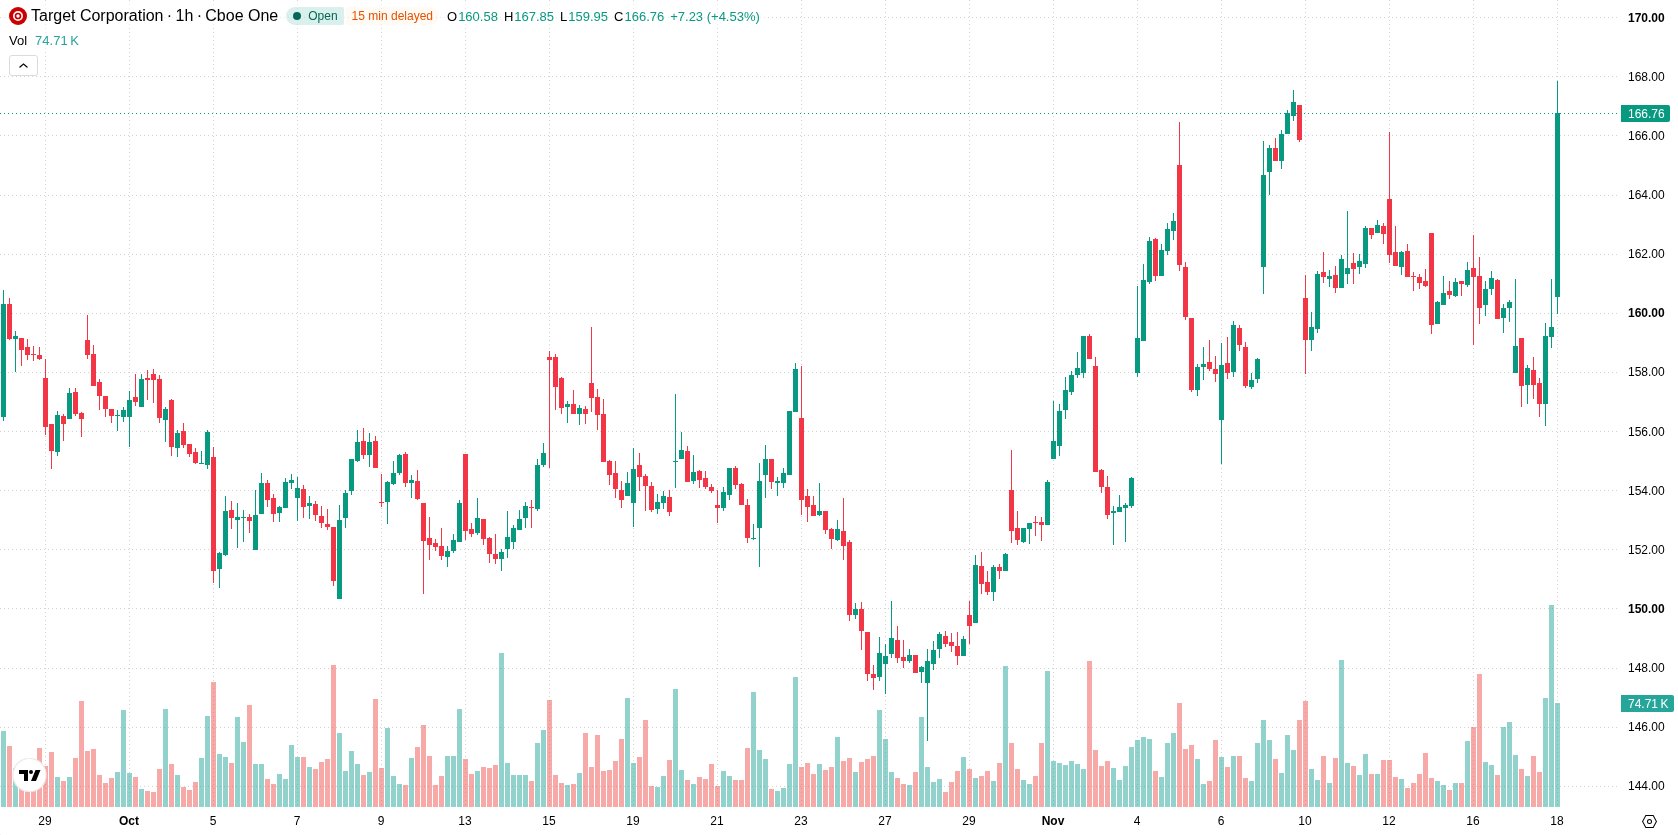
Target (TGT) stock is trading at $166.73 after advancing 4.53% on the day. The price currently sits above its key moving averages, highlighting strong momentum across timeframes.
 171.91
Highlights
- Target stock climbed after the company exceeded third-quarter 2026 sales and earnings forecasts, prompting a higher full-year outlook.
- Net sales rose 7.1% and comparable sales grew 5.6%, with shareholder returns including a $0.50 per share tariff refund, $527 million in dividends, and $251 million in buybacks.
- Target stock trades with bullish intraday momentum above key technical support, but signals indicate possible short-term consolidation between $157.96 and $170.98.
Earnings beat and upbeat outlook fuel sustained investor demand
Target's third-quarter 2026 results exceeded both sales and earnings forecasts, delivering a positive earnings surprise that has sparked increased demand from investors. According to CNBC, the company also raised its full-year sales and EPS outlook during the period, reinforcing improved growth expectations and supporting current buying interest in the shares. Additional factors include a 7.1% rise in net sales and 5.6% growth in comparable sales, as well as robust shareholder returns through a one-time $0.50 per share tariff refund, $527 million in dividends, and $251 million in share repurchases, all contributing to the stock's current momentum.
Mixed momentum signals as bullish action meets overheating risk
On the technical front, TGT/USD is trading above the H1 SMA-20 at $159.84, above the H1 SMA-50 at $161.35, and well clear of the D1 SMA-200 at $137.24. The Ichimoku Kijun offers immediate support at $159.45. MACD flashes a Sell signal and ADX is Neutral, with RSI and CCI both remaining in neutral territory. Stoch RSI is overbought, signaling short-term overheating risk, while Bull/Bear Power is positive at 1.73, indicating buyers continue to dominate intraday momentum. The Awesome Oscillator (AO) remains Neutral, creating a landscape of mixed technical signals amid bullish price action.
Consolidation favored as bearish odds edge out amid volatility
For the next several trading days, TGT is expected to consolidate within a range of $157.96 to $170.98 based on typical volatility bands. There is a 52% probability for a downward move and a 48% probability for an upward move, suggesting a slight bearish tilt in the short term. The most likely outcome is continued range-bound trading unless price breaks decisively above resistance or falls below support, which would trigger either a bullish continuation or a bearish reversal scenario.
Earlier, analysts noted that Target's turnaround efforts were being closely watched for clear signs of sustained recovery heading into the busy holiday period. With the latest results delivering growth beyond expectations and upwardly revised guidance, traders should now monitor the $157.96–$170.98 range for confirmation of a breakout or reversal in the near term.






Latest Target News





-
 Afghanistan
-
 Albania
-
 Algeria
-
 Angola
-
 Argentina
-
 Armenia
-
 Australia
-
 Austria
-
 Azerbaijan
-
 Bahamas
-
 Bahrain
-
 Bangladesh
-
 Belarus
-
 Belgium
-
 Bolivia
-
 Botswana
-
 Brazil
-
 Brunei
-
 Bulgaria
-
 Cambodia
-
 Cameroon
-
 Canada
-
 Chile
-
 China
-
 Colombia
-
 Congo
-
 Costa Rica
-
 Cote d'Ivoire
-
 Croatia
-
 Cuba
-
 Cyprus
-
 Czechia
-
 DR Congo
-
 Denmark
-
 Dominican Republic
-
 Ecuador
-
 Egypt
-
 El Salvador
-
 Estonia
-
 Eswatini
-
 Ethiopia
-
 Finland
-
 France
-
 Georgia
-
 Germany
-
 Ghana
-
 Greece
-
 Haiti
-
 Hong Kong
-
 Hungary
-
 India
-
 Indonesia
-
 Iran, Islamic republic
-
 Iraq
-
 Ireland
-
 Israel
-
 Italy
-
 Jamaica
-
 Japan
-
 Jordan
-
 Kazakhstan
-
 Kenya
-
 Korea
-
 Kuwait
-
 Kyrgyzstan
-
 Laos
-
 Latvia
-
 Lebanon
-
 Lesotho
-
 Libya
-
 Lithuania
-
 Luxembourg
-
 Madagascar
-
 Malaysia
-
 Malta
-
 Mauritius
-
 Mexico
-
 Moldova
-
 Mongolia
-
 Montenegro
-
 Morocco
-
 Mozambique
-
 Myanmar
-
 Namibia
-
 Nepal
-
 Netherlands
-
 New Zealand
-
 Nigeria
-
 North Macedonia
-
 Norway
-
 Oman
-
 Pakistan
-
 Palestine
-
 Panama
-
 Papua New Guinea
-
 Paraguay
-
 Peru
-
 Philippines
-
 Poland
-
 Portugal
-
 Puerto Rico
-
 Qatar
-
 Reunion
-
 Romania
-
 Rwanda
-
 Saudi Arabia
-
 Serbia
-
 Singapore
-
 Slovakia
-
 Slovenia
-
 Somalia
-
 South Africa
-
 Spain
-
 Sri Lanka
-
 Sweden
-
 Switzerland
-
 Syria
-
 Taiwan
-
 Tajikistan
-
 Tanzania
-
 Thailand
-
 Trinidad and Tobago
-
 Tunisia
-
 Turkey
-
 UAE
-
 Uganda
-
 Ukraine
-
 United Kingdom
-
United States
-
 Uruguay
-
 Uzbekistan
-
 Venezuela
-
 Vietnam
-
 Yemen
-
 Zambia
-
 Zimbabwe
- Forex
- Crypto












