

MSTR slides as technical signals confirm seller pressure

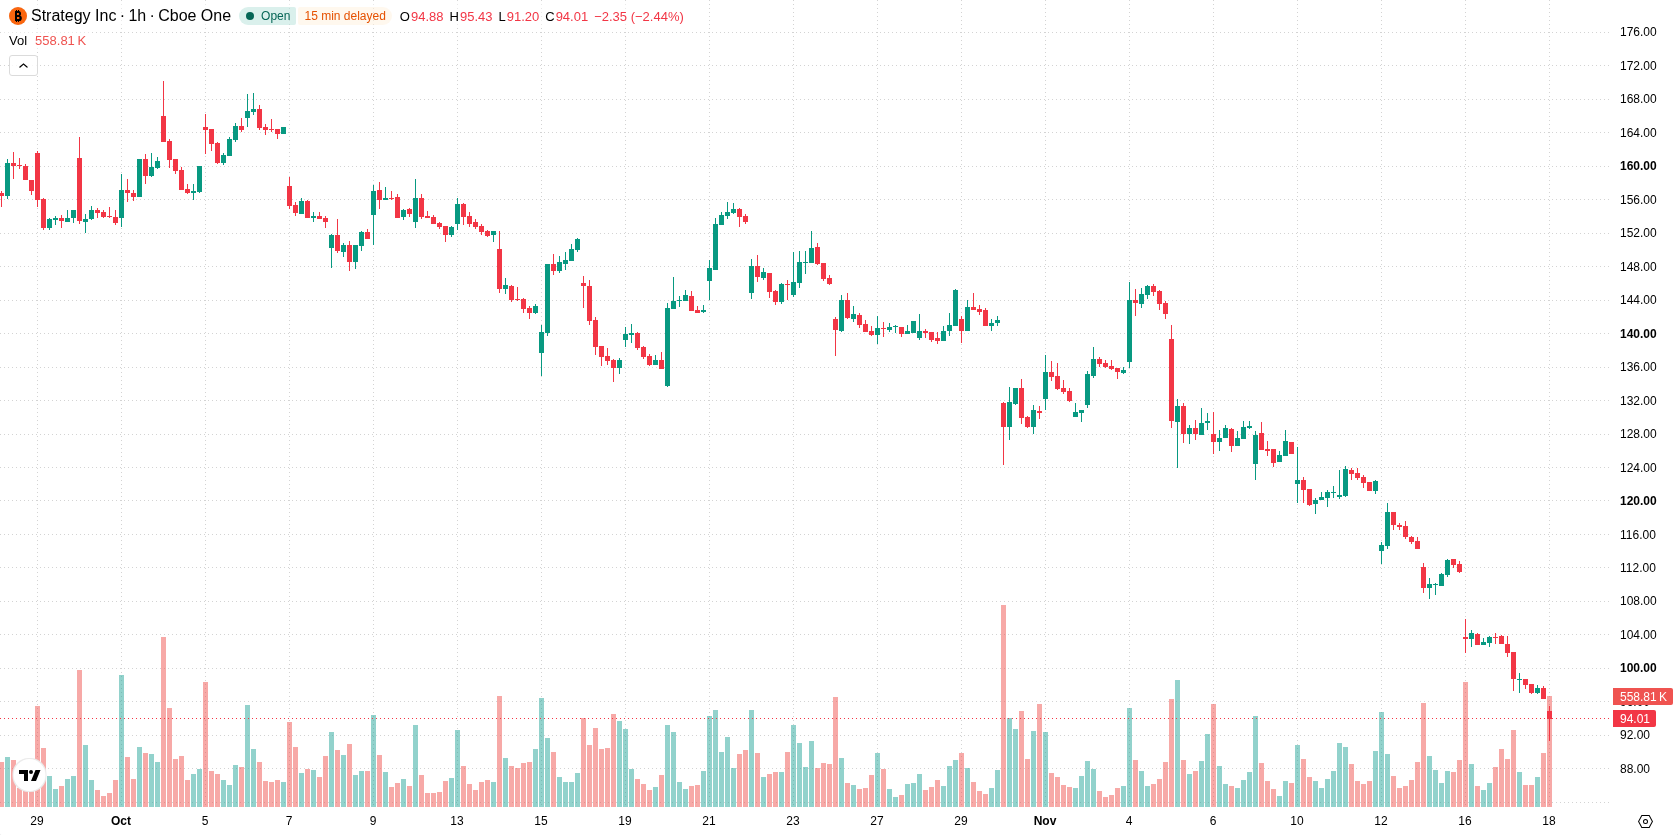
Strategy (MSTR, formerly MicroStrategy) stock is trading at $94.77, down 1.76% for the day. The price currently sits below its key moving averages, reflecting a pronounced loss of momentum over the session.
 103.70
119.53
Highlights
- Strategy Inc. raised $244.7 million through an equity sale, spending 84% of proceeds on repurchasing STRC preferred stock.
- Only $33.4 million of newly raised capital went into Bitcoin, signaling a shift toward liability management instead of crypto accumulation.
- Sellers control momentum with price trading below key averages, negative signals across major indicators, and a projected range of $84.46 to $105.08.
Index removal and liability focus drive institutional selling pressure
Strategy Inc. (MSTR) conducted a major equity sale between November 9 and November 15, raising $244.7 million from selling nearly 2.09 million common shares, with 84% of proceeds allocated to repurchasing STRC preferred stock, according to Yahoo Finance and Stocktwits. During this period, only a small portion of the raised capital—about $33.4 million—was invested in Bitcoin, highlighting a focus on liability management over expanding crypto exposure. Institutional dynamics also weighed on shares after MSCI announced on November 11, 2026, that Strategy would be removed from its major indexes, a move expected to trigger forced selling of up to 13 million shares, as reported by Cryptobriefing.
Oversold conditions emerge amid persistent multi-timeframe selling bias
MSTR is currently trading below the H1 SMA-20 at $104.04, H1 SMA-50 at $114.34, and D1 SMA-200 at $132.33. The Ichimoku Kijun at $107.52 acts as immediate resistance. Sellers are dominating across timeframes, with both MACD and ADX confirming a Sell bias. RSI, Stochastic RSI, and CCI are positioned in their respective oversold zones, indicating the potential for a short-term rebound, but not confirming a reversal. Bull/Bear Power remains negative, reflecting ongoing seller dominance intraday.
Downside breakout risk elevated as rebound prospects fade
In the short term, MSTR is projected to trade within a volatility band between $84.46 and $105.08 over the next several trading days. The probability of a strong rebound is currently low, while the risk of further downside remains high. A sustained move higher would require a break above $107.52, the immediate resistance level, while a breach of support near $84.46 could accelerate further declines. The most likely scenario sees the price ranging within the stated bounds, with a downside breakout possible if current pressures persist.
Earlier, analysts noted that bearish technical patterns and Strategy’s strong correlation to bitcoin had left the stock vulnerable to substantial declines. The latest trading signals and equity sale activity reinforce this downside risk, making $84.46 the critical support level to watch for potential acceleration of losses.






Latest Strategy News




-
 Afghanistan
-
 Albania
-
 Algeria
-
 Angola
-
 Argentina
-
 Armenia
-
 Australia
-
 Austria
-
 Azerbaijan
-
 Bahamas
-
 Bahrain
-
 Bangladesh
-
 Belarus
-
 Belgium
-
 Bolivia
-
 Botswana
-
 Brazil
-
 Brunei
-
 Bulgaria
-
 Cambodia
-
 Cameroon
-
 Canada
-
 Chile
-
 China
-
 Colombia
-
 Congo
-
 Costa Rica
-
 Cote d'Ivoire
-
 Croatia
-
 Cuba
-
 Cyprus
-
 Czechia
-
 DR Congo
-
 Denmark
-
 Dominican Republic
-
 Ecuador
-
 Egypt
-
 El Salvador
-
 Estonia
-
 Eswatini
-
 Ethiopia
-
 Finland
-
 France
-
 Georgia
-
 Germany
-
 Ghana
-
 Greece
-
 Haiti
-
 Hong Kong
-
 Hungary
-
 India
-
 Indonesia
-
 Iran, Islamic republic
-
 Iraq
-
 Ireland
-
 Israel
-
 Italy
-
 Jamaica
-
 Japan
-
 Jordan
-
 Kazakhstan
-
 Kenya
-
 Korea
-
 Kuwait
-
 Kyrgyzstan
-
 Laos
-
 Latvia
-
 Lebanon
-
 Lesotho
-
 Libya
-
 Lithuania
-
 Luxembourg
-
 Madagascar
-
 Malaysia
-
 Malta
-
 Mauritius
-
 Mexico
-
 Moldova
-
 Mongolia
-
 Montenegro
-
 Morocco
-
 Mozambique
-
 Myanmar
-
 Namibia
-
 Nepal
-
 Netherlands
-
 New Zealand
-
 Nigeria
-
 North Macedonia
-
 Norway
-
 Oman
-
 Pakistan
-
 Palestine
-
 Panama
-
 Papua New Guinea
-
 Paraguay
-
 Peru
-
 Philippines
-
 Poland
-
 Portugal
-
 Puerto Rico
-
 Qatar
-
 Reunion
-
 Romania
-
 Rwanda
-
 Saudi Arabia
-
 Serbia
-
 Singapore
-
 Slovakia
-
 Slovenia
-
 Somalia
-
 South Africa
-
 Spain
-
 Sri Lanka
-
 Sweden
-
 Switzerland
-
 Syria
-
 Taiwan
-
 Tajikistan
-
 Tanzania
-
 Thailand
-
 Trinidad and Tobago
-
 Tunisia
-
 Turkey
-
 UAE
-
 Uganda
-
 Ukraine
-
 United Kingdom
-
United States
-
 Uruguay
-
 Uzbekistan
-
 Venezuela
-
 Vietnam
-
 Yemen
-
 Zambia
-
 Zimbabwe
- Forex
- Crypto












