

Meta Platforms stock forecast: Seller pressure keeps price below $628.64 resistance

Meta Platforms (META) stock is trading at $613.89, showing a modest decline following a gap down at the open and moderate intraday volatility. The price remains below its key moving averages, reflecting ongoing weakness relative to short-term and long-term trend levels.
 620.30
643.77
Highlights
- Meta Platforms expanded its product lineup with three new cloud-based features through its strategic partnership with Microsoft.
- Meta Platforms completed $25 billion in bond sales to finance data center and AI infrastructure investment, strengthening its innovation capital.
- Shares of Meta Platforms traded at $613.89, below key moving averages, with technical indicators showing prevailing bearish momentum and a short-term expected range of $600.53 to $627.25.
Cloud partnership and bond deal bolster innovation funding
Meta Platforms expanded its product lineup through its strategic partnership with Microsoft, releasing three new features—Muse Wonder, Muse Spark 1.3, and Muse Ember—on Microsoft Foundry on Azure, according to Gurufocus. This collaboration is expected to strengthen Meta's positioning in cloud-based services and deepen integration with Microsoft's ecosystem. Additionally, the company completed $25 billion in bond sales to support data center and AI infrastructure investment, providing substantial long-term capital for innovation, as reported by TradingView.
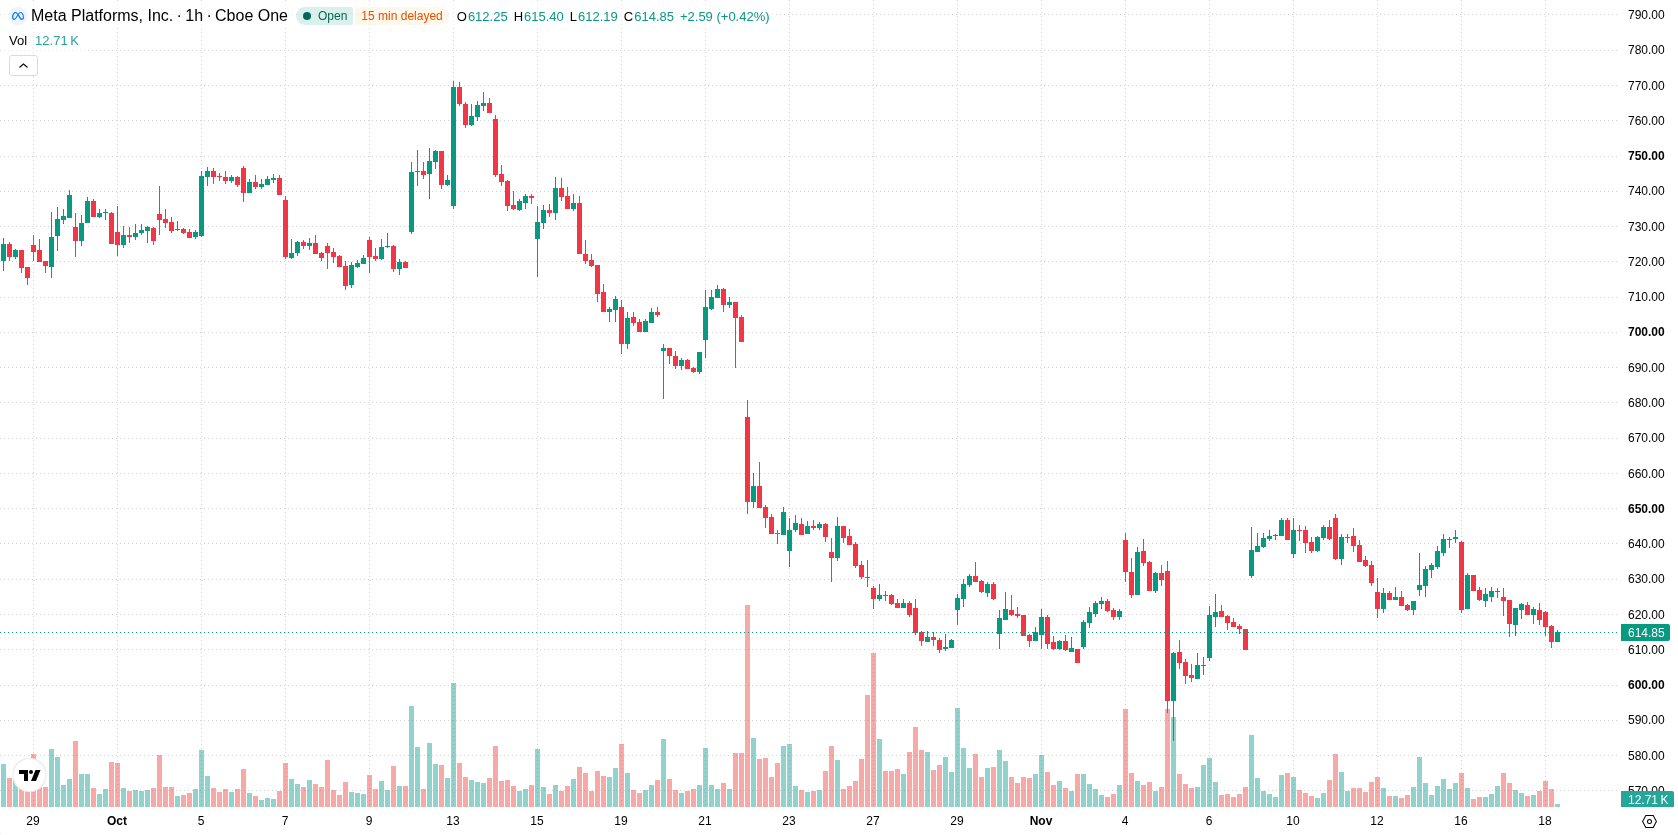
Downward momentum intensifies as sellers dominate and oversold signals emerge
On the technical front, META is trading below the H1 SMA-20 at $626.12, H1 SMA-50 at $631.6, and D1 SMA-200 at $629.85, with the Ichimoku Kijun at $628.64 establishing immediate resistance. MACD and ADX both show sell signals, confirming the prevalence of downward momentum. RSI is neutral, while both Stochastic RSI and CCI have entered oversold zones, suggesting room for a potential short-term bounce. Bull/Bear Power remains negative, underscoring sustained seller dominance, while the Awesome Oscillator is neutral, providing no additional directional confirmation.
Range-bound outlook holds as bearish risk remains elevated
In the short term, META is expected to consolidate within a typical volatility band of $600.53 to $627.25. The probability of a further decline is high, with potential for a downward scenario if the $600.53 support is breached and selling accelerates. A bullish reversal would require a decisive move above the $628.64 resistance, while the baseline scenario anticipates a period of range-bound trading between support and resistance levels.
Earlier, analysts noted that Meta Platforms was facing sustained technical weakness and elevated risk amid new product launches and large-scale bond issuance. The latest developments reinforce this cautious outlook, with downside risk intensifying should the $600.53 support level fail to hold.











-
 Afghanistan
-
 Albania
-
 Algeria
-
 Angola
-
 Argentina
-
 Armenia
-
 Australia
-
 Austria
-
 Azerbaijan
-
 Bahamas
-
 Bahrain
-
 Bangladesh
-
 Belarus
-
 Belgium
-
 Bolivia
-
 Botswana
-
 Brazil
-
 Brunei
-
 Bulgaria
-
 Cambodia
-
 Cameroon
-
 Canada
-
 Chile
-
 China
-
 Colombia
-
 Congo
-
 Costa Rica
-
 Cote d'Ivoire
-
 Croatia
-
 Cuba
-
 Cyprus
-
 Czechia
-
 DR Congo
-
 Denmark
-
 Dominican Republic
-
 Ecuador
-
 Egypt
-
 El Salvador
-
 Estonia
-
 Eswatini
-
 Ethiopia
-
 Finland
-
 France
-
 Georgia
-
 Germany
-
 Ghana
-
 Greece
-
 Haiti
-
 Hong Kong
-
 Hungary
-
 India
-
 Indonesia
-
 Iran, Islamic republic
-
 Iraq
-
 Ireland
-
 Israel
-
 Italy
-
 Jamaica
-
 Japan
-
 Jordan
-
 Kazakhstan
-
 Kenya
-
 Korea
-
 Kuwait
-
 Kyrgyzstan
-
 Laos
-
 Latvia
-
 Lebanon
-
 Lesotho
-
 Libya
-
 Lithuania
-
 Luxembourg
-
 Madagascar
-
 Malaysia
-
 Malta
-
 Mauritius
-
 Mexico
-
 Moldova
-
 Mongolia
-
 Montenegro
-
 Morocco
-
 Mozambique
-
 Myanmar
-
 Namibia
-
 Nepal
-
 Netherlands
-
 New Zealand
-
 Nigeria
-
 North Macedonia
-
 Norway
-
 Oman
-
 Pakistan
-
 Palestine
-
 Panama
-
 Papua New Guinea
-
 Paraguay
-
 Peru
-
 Philippines
-
 Poland
-
 Portugal
-
 Puerto Rico
-
 Qatar
-
 Reunion
-
 Romania
-
 Rwanda
-
 Saudi Arabia
-
 Serbia
-
 Singapore
-
 Slovakia
-
 Slovenia
-
 Somalia
-
 South Africa
-
 Spain
-
 Sri Lanka
-
 Sweden
-
 Switzerland
-
 Syria
-
 Taiwan
-
 Tajikistan
-
 Tanzania
-
 Thailand
-
 Trinidad and Tobago
-
 Tunisia
-
 Turkey
-
 UAE
-
 Uganda
-
 Ukraine
-
 United Kingdom
-
United States
-
 Uruguay
-
 Uzbekistan
-
 Venezuela
-
 Vietnam
-
 Yemen
-
 Zambia
-
 Zimbabwe
- Forex
- Crypto












