

TSCO trades flat as buyer support underpins the current range

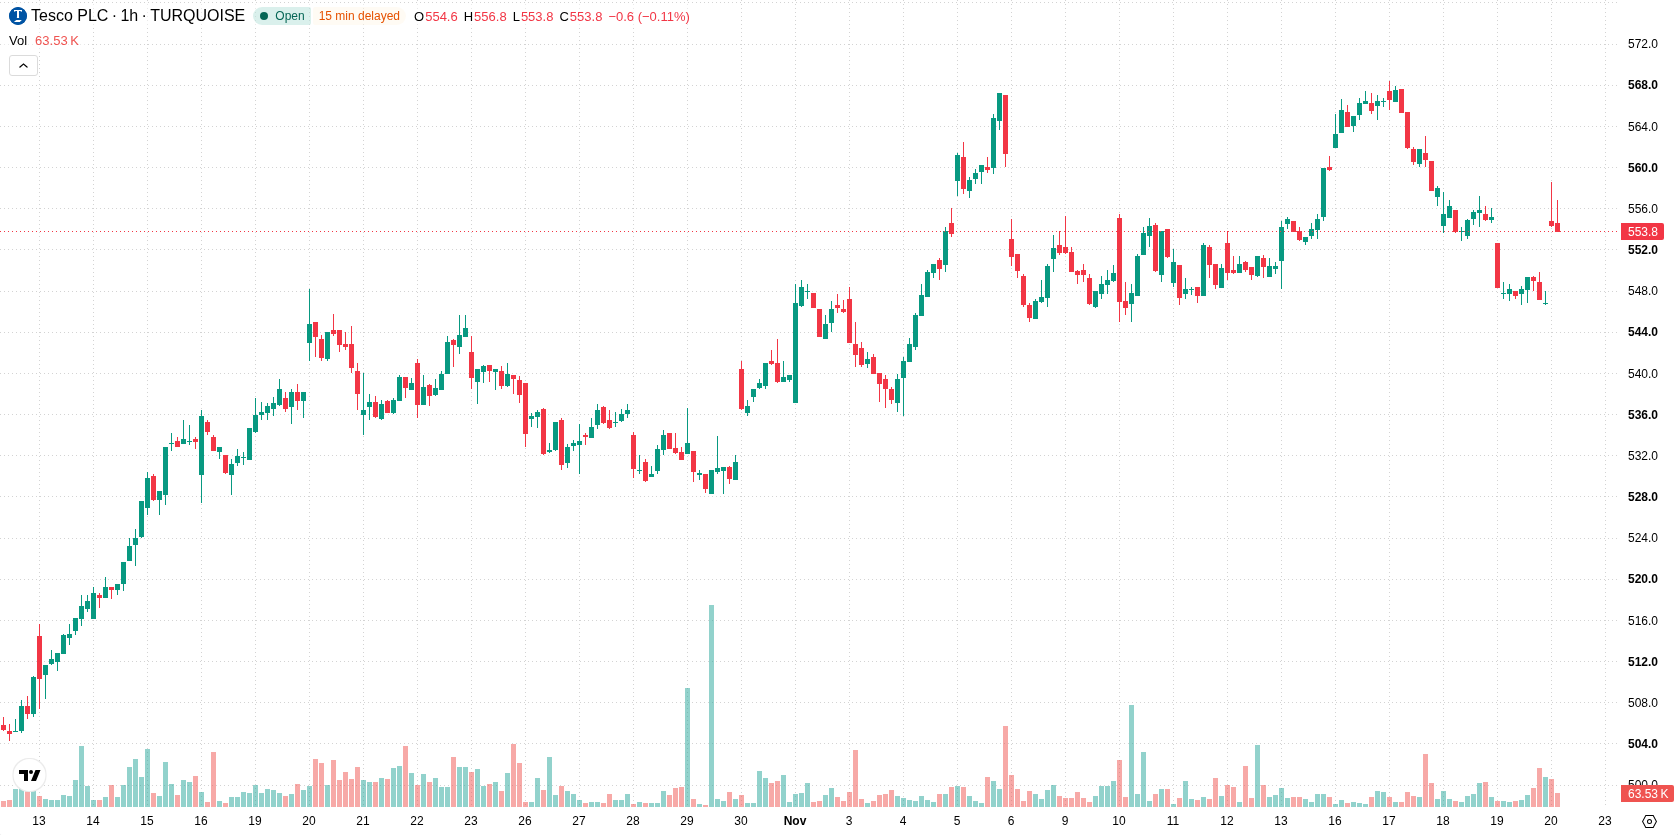
Tesco (TSCO) stock is trading at GBX555, recording a modest gain on the day. The price sits above its near-term moving average but remains just under some short-term averages, suggesting a tentative positive bias with resistance nearby.
 559.20
569.00
Highlights
- Tesco repurchased 1,661 ordinary shares at 547.38p each as part of its ongoing £950 million buyback program, decreasing total outstanding shares to 6,232,685,285.
- No treasury shares are held after this transaction, and the buyback activity modestly supports per-share performance and market liquidity.
- Shares of Tesco are forecast to trade between GBX544.89 to GBX565.11 in the next 2 to 3 days, with mixed technical signals and a 76% probability of an upward move.
Buyback activity supports shares as liquidity demand rises
Tesco executed an on-market repurchase of 1,661 ordinary shares at an average price of 547.38p on November 19, 2026, part of its ongoing £950 million share buyback programme authorized at the 2026 Annual General Meeting, according to Investegate Co. This transaction slightly reduces the total share count to 6,232,685,285 and confirms Tesco is not holding any treasury shares. The continued buyback activity modestly increases liquidity demand and provides steady support to per-share performance in the current market environment.
Mixed momentum and resistance capped by short-term averages
On the technical front, TSCO is positioned above the H1 SMA-20 at GBX551.81 but just below the H1 SMA-50 at GBX556.7, highlighting short-term resistance in the GBX556 zone. The D1 SMA-200 at GBX481.31 remains well below current levels, acting as a solid longer-term support. The Ichimoku Kijun at GBX556.1 also reinforces immediate resistance. Indicator readings are mixed: MACD signals strong sell momentum, while ADX shows buy strength. RSI and CCI are both neutral, whereas Stoch RSI is in the overbought range, pointing to potential short-term overheating. Bull/Bear Power registers a positive 4.22, indicating buying dominance on an intraday basis, but the Awesome Oscillator remains neutral and does not provide trend confirmation.
Sideways trading projected as breakout risks remain balanced
Over the next 2–3 trading days, TSCO is expected to trade in a range between GBX544.89 and GBX565.11 under typical volatility conditions. The base case scenario sees price action remaining sideways within this band. If the price can close above immediate resistance near GBX556, a breakout toward the upper end of the range is likely, aligning with the 76% probability of further gains. Conversely, a close below support at the lower boundary near GBX545 would shift short-term risks to the downside, with the chance of a decline estimated at 24%.
Earlier, analysts noted that Tesco shares showed bullish technical momentum after its recent share buyback activity. The current analysis adds a new dimension by highlighting mixed short-term signals and underscores that traders should closely watch the GBX556 resistance as a trigger for the next directional move.











-
 Afghanistan
-
 Albania
-
 Algeria
-
 Angola
-
 Argentina
-
 Armenia
-
 Australia
-
 Austria
-
 Azerbaijan
-
 Bahamas
-
 Bahrain
-
 Bangladesh
-
 Belarus
-
 Belgium
-
 Bolivia
-
 Botswana
-
 Brazil
-
 Brunei
-
 Bulgaria
-
 Cambodia
-
 Cameroon
-
 Canada
-
 Chile
-
 China
-
 Colombia
-
 Congo
-
 Costa Rica
-
 Cote d'Ivoire
-
 Croatia
-
 Cuba
-
 Cyprus
-
 Czechia
-
 DR Congo
-
 Denmark
-
 Dominican Republic
-
 Ecuador
-
 Egypt
-
 El Salvador
-
 Estonia
-
 Eswatini
-
 Ethiopia
-
 Finland
-
 France
-
 Georgia
-
 Germany
-
 Ghana
-
 Greece
-
 Haiti
-
 Hong Kong
-
 Hungary
-
 India
-
 Indonesia
-
 Iran, Islamic republic
-
 Iraq
-
 Ireland
-
 Israel
-
 Italy
-
 Jamaica
-
 Japan
-
 Jordan
-
 Kazakhstan
-
 Kenya
-
 Korea
-
 Kuwait
-
 Kyrgyzstan
-
 Laos
-
 Latvia
-
 Lebanon
-
 Lesotho
-
 Libya
-
 Lithuania
-
 Luxembourg
-
 Madagascar
-
 Malaysia
-
 Malta
-
 Mauritius
-
 Mexico
-
 Moldova
-
 Mongolia
-
 Montenegro
-
 Morocco
-
 Mozambique
-
 Myanmar
-
 Namibia
-
 Nepal
-
 Netherlands
-
 New Zealand
-
 Nigeria
-
 North Macedonia
-
 Norway
-
 Oman
-
 Pakistan
-
 Palestine
-
 Panama
-
 Papua New Guinea
-
 Paraguay
-
 Peru
-
 Philippines
-
 Poland
-
 Portugal
-
 Puerto Rico
-
 Qatar
-
 Reunion
-
 Romania
-
 Rwanda
-
 Saudi Arabia
-
 Serbia
-
 Singapore
-
 Slovakia
-
 Slovenia
-
 Somalia
-
 South Africa
-
 Spain
-
 Sri Lanka
-
 Sweden
-
 Switzerland
-
 Syria
-
 Taiwan
-
 Tajikistan
-
 Tanzania
-
 Thailand
-
 Trinidad and Tobago
-
 Tunisia
-
 Turkey
-
 UAE
-
 Uganda
-
 Ukraine
-
 United Kingdom
-
United States
-
 Uruguay
-
 Uzbekistan
-
 Venezuela
-
 Vietnam
-
 Yemen
-
 Zambia
-
 Zimbabwe
- Forex
- Crypto












