


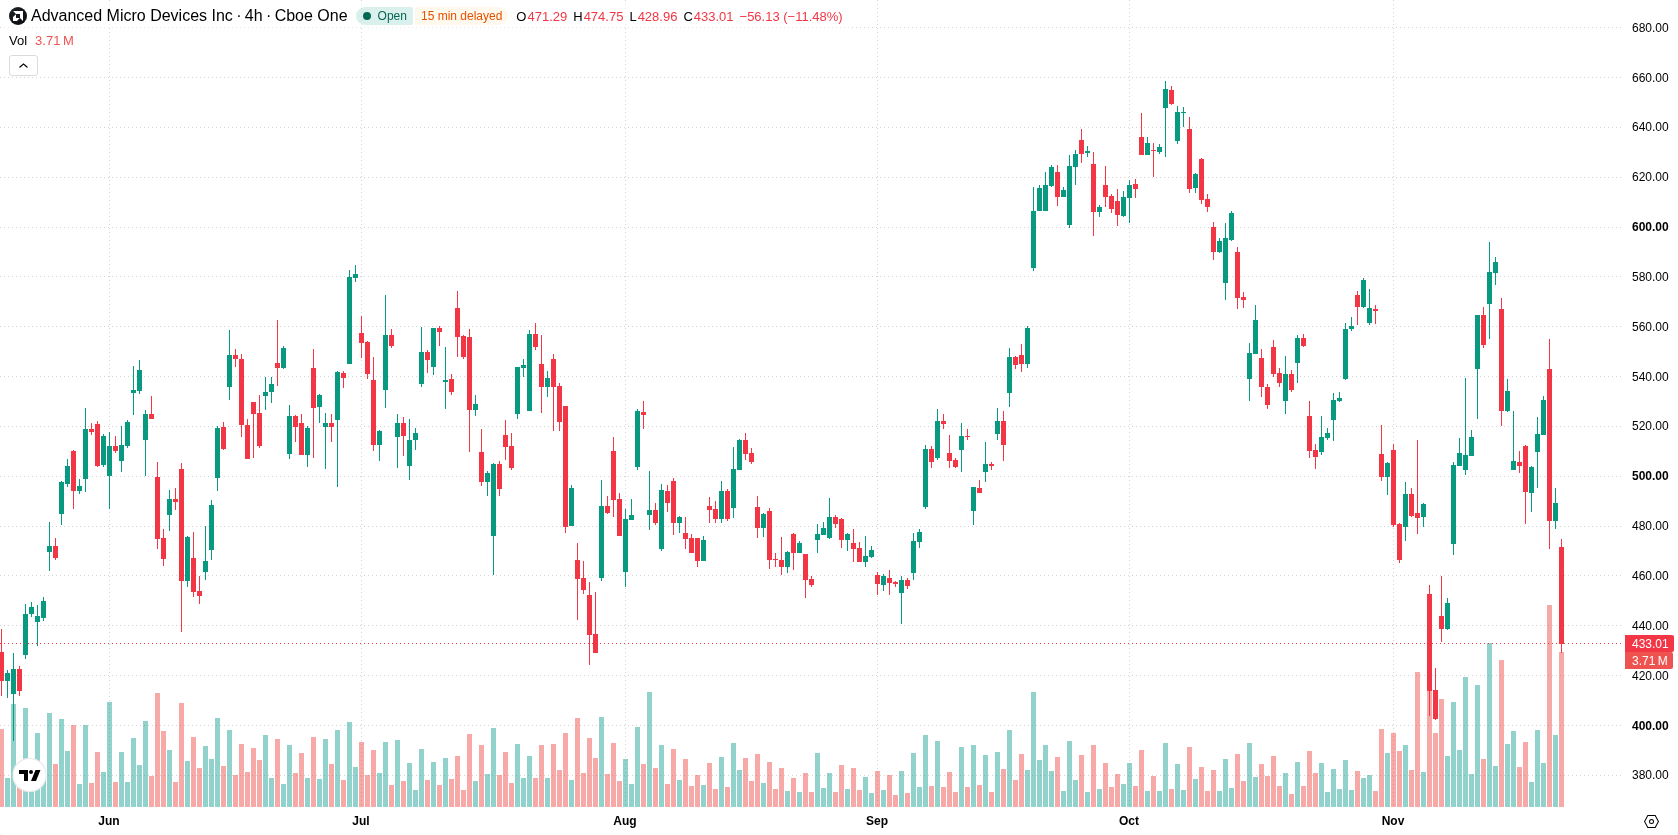
Advanced Micro Devices (AMD) dropped 11.68% after record revenue was overshadowed by negative investor sentiment tied to concerns over its business with certain Chinese server manufacturers. Technical pressures reinforce the move, with AMD trading below its 20- and 50-day moving averages while structural support remains at the 200-day level.
 474.79
555.01
Highlights
- AMD reported record third-quarter revenue of $13.4 billion, reaching its highest level to date.
- The stock faced scrutiny following Hunterbrook Capital's bearish position and questions over Chinese server manufacturer relationships.
- Shares of AMD traded below key short-term technical levels, with a projected five-day range of $389.8 to $474.25 and a strong probability of further declines.
Bearish positioning intensifies after short-seller scrutiny of China ties
AMD reported record third-quarter revenue of $13.4 billion. The stock faced increased scrutiny due to a bearish position from short-seller Hunterbrook Capital, which questioned AMD's relationships with certain Chinese server manufacturers. The firm has continued expanding its AI chip offerings without distributing dividends, making shareholder returns reliant on price appreciation, though price action has remained under broader selling pressure.
Sellers exert pressure as momentum weakens despite structural support
AMD is trading below its 20-day ($513.18) and 50-day ($554.76) moving averages, indicating short- and medium-term pressure from sellers, while remaining above the 200-day moving average ($428.56), confirming longer-term structural support. The near-term ceiling is defined by the session low at $470.56, with the 200-day moving average at $428.56 marking the nearest floor. The longer-term trend bias remains bullish as the 50-day average stands above the 200-day. Momentum readings are negative, with the MACD signaling strong sell and the ADX indicating a neutral trend. The RSI, Stochastic RSI, and CCI all register in their neutral zones, reflecting a lack of extreme technical conditions. Bull/Bear Power shows buyer dominance intraday, while the Awesome Oscillator also supports bearish momentum. The tone is weak, intraday volatility is elevated at 17.95%, and sellers are dominating the session.
Earlier, analysts noted that AMD was facing persistent short-term downside momentum amid heightened regulatory scrutiny and integration risks from recent acquisitions. The current analysis confirms that bearish technical conditions and unresolved regulatory concerns continue to dominate, with traders advised to monitor the 200-day moving average at $428.56 as a critical level for potential further declines.











-
 Afghanistan
-
 Albania
-
 Algeria
-
 Angola
-
 Argentina
-
 Armenia
-
 Australia
-
 Austria
-
 Azerbaijan
-
 Bahamas
-
 Bahrain
-
 Bangladesh
-
 Belarus
-
 Belgium
-
 Bolivia
-
 Botswana
-
 Brazil
-
 Brunei
-
 Bulgaria
-
 Cambodia
-
 Cameroon
-
 Canada
-
 Chile
-
 China
-
 Colombia
-
 Congo
-
 Costa Rica
-
 Cote d'Ivoire
-
 Croatia
-
 Cuba
-
 Cyprus
-
 Czechia
-
 DR Congo
-
 Denmark
-
 Dominican Republic
-
 Ecuador
-
 Egypt
-
 El Salvador
-
 Estonia
-
 Eswatini
-
 Ethiopia
-
 Finland
-
 France
-
 Georgia
-
 Germany
-
 Ghana
-
 Greece
-
 Haiti
-
 Hong Kong
-
 Hungary
-
 India
-
 Indonesia
-
 Iran, Islamic republic
-
 Iraq
-
 Ireland
-
 Israel
-
 Italy
-
 Jamaica
-
 Japan
-
 Jordan
-
 Kazakhstan
-
 Kenya
-
 Korea
-
 Kuwait
-
 Kyrgyzstan
-
 Laos
-
 Latvia
-
 Lebanon
-
 Lesotho
-
 Libya
-
 Lithuania
-
 Luxembourg
-
 Madagascar
-
 Malaysia
-
 Malta
-
 Mauritius
-
 Mexico
-
 Moldova
-
 Mongolia
-
 Montenegro
-
 Morocco
-
 Mozambique
-
 Myanmar
-
 Namibia
-
 Nepal
-
 Netherlands
-
 New Zealand
-
 Nigeria
-
 North Macedonia
-
 Norway
-
 Oman
-
 Pakistan
-
 Palestine
-
 Panama
-
 Papua New Guinea
-
 Paraguay
-
 Peru
-
 Philippines
-
 Poland
-
 Portugal
-
 Puerto Rico
-
 Qatar
-
 Reunion
-
 Romania
-
 Rwanda
-
 Saudi Arabia
-
 Serbia
-
 Singapore
-
 Slovakia
-
 Slovenia
-
 Somalia
-
 South Africa
-
 Spain
-
 Sri Lanka
-
 Sweden
-
 Switzerland
-
 Syria
-
 Taiwan
-
 Tajikistan
-
 Tanzania
-
 Thailand
-
 Trinidad and Tobago
-
 Tunisia
-
 Turkey
-
 UAE
-
 Uganda
-
 Ukraine
-
 United Kingdom
-
United States
-
 Uruguay
-
 Uzbekistan
-
 Venezuela
-
 Vietnam
-
 Yemen
-
 Zambia
-
 Zimbabwe
- Forex
- Crypto












