


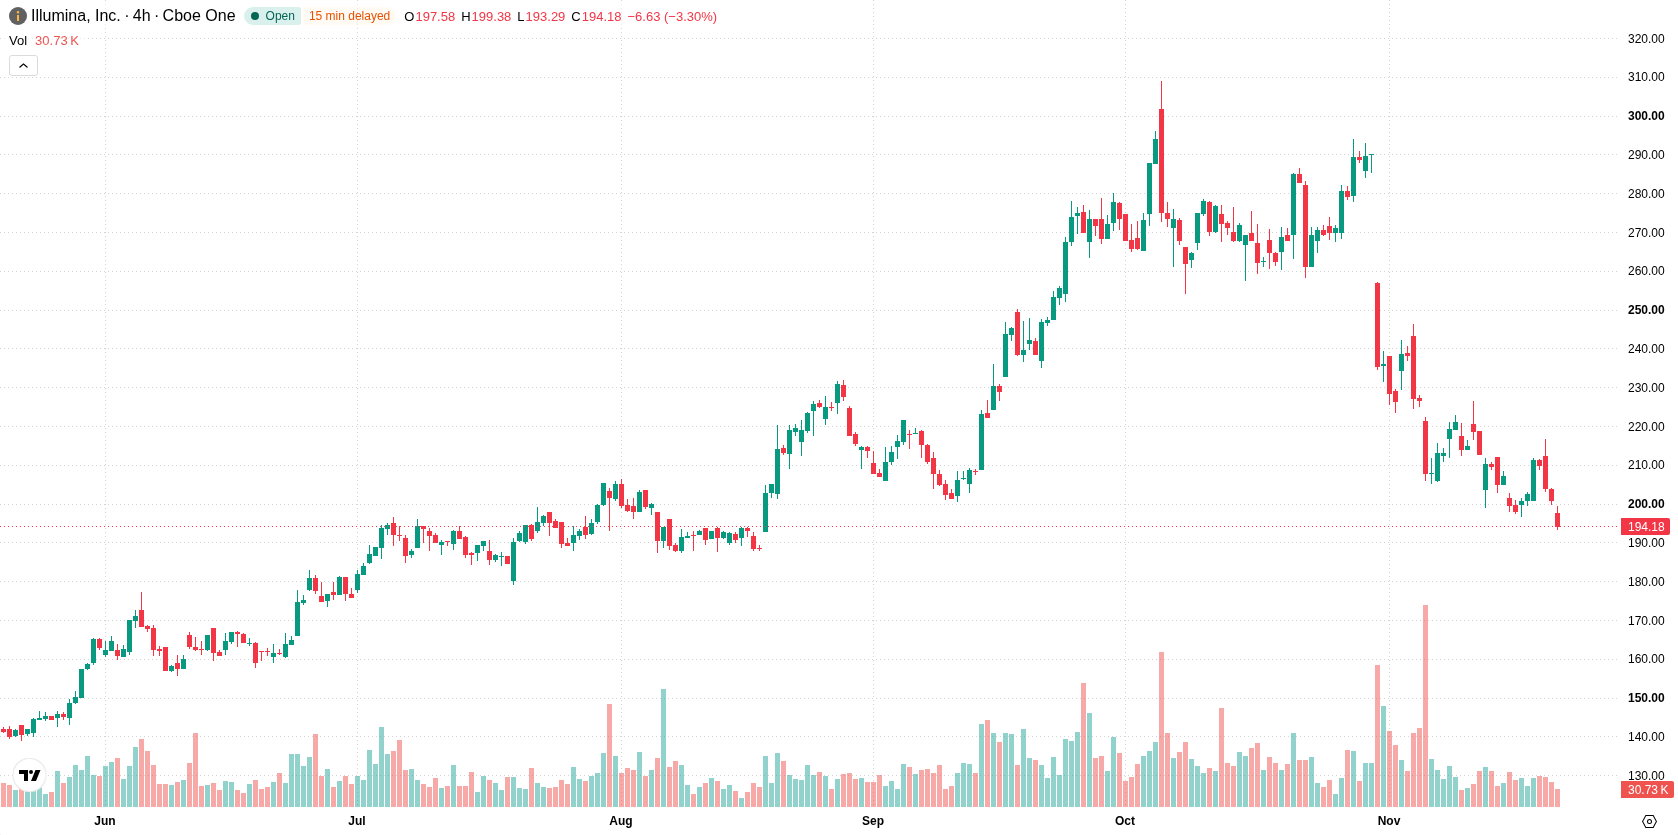
Illumina, Inc. (ILMN) fell 3.47% as sellers dominated the session, with negative technical momentum and persistent intraday pressure. The move is supported by the stock's position below its 20-day and 50-day moving averages and a prevailing bearish short- and medium-term structure.
 199.24
216.58
Highlights
- Illumina raised its 2026 revenue and earnings outlook due to strong clinical sequencing demand and new product launches.
- Institutional investment in Illumina increased, with new and growing positions by major asset managers amid ongoing share price pressure.
- Shares of Illumina last traded at $193.7, within a projected five-day range of $183.73 to $203.66, as bearish momentum and selling pressure persist.
Institutional buying rises despite persistent selling pressure and product gains
Illumina has guided for resilient clinical sequencing and highlighted the continued adoption of its NovaSeq X platform and expansion into data-driven businesses. The company raised its full year 2026 revenue and earnings outlook, citing strong clinical demand and new product launches in molecular residual disease research. Illumina's BioInsight AI Lab won the 2026 Virtual Cell Challenge, and increased institutional investment activity was reported, including new and growing positions by major asset managers, though price action has remained under broader selling pressure.
Short- and medium-term weakness prevails as longer-term support holds
Illumina is trading below its 20-day and 50-day moving averages at $231.11 and $248.54, but remains above the 200-day average at $180.8. This structure points to prevailing short- and medium-term selling pressure, while the longer-term setup still leans constructive, with immediate resistance near $194.09 and potential support at $183.73. Momentum readings reflect a bearish setup, as both the MACD and Average Directional Index (ADX) suggest negative momentum. The Relative Strength Index (RSI), Stochastic RSI, and Commodity Channel Index (CCI) are all neutral, indicating no extreme overbought or oversold conditions in oscillators. Bull/Bear Power (BBP) shows buyers remain slightly dominant intraday. The stock last traded at $193.7, down 3.47% or $6.96 for the day, following a downside gap of approximately 1.54%. Price action is parked near the session low, with intraday volatility at 2.65%. Pressure was evident after the open and persisted as the session progressed, aligning with broader momentum signals.
Earlier, analysts noted that Illumina was experiencing persistent short- and medium-term selling pressure amid technical weakness despite maintaining support on longer timeframes. The updated analysis reinforces this bearish structure, highlighting a very high probability of downside movement in the coming week, with $183.73 as the critical support level to monitor for a potential breakdown.






Latest Illumina News



-
 Afghanistan
-
 Albania
-
 Algeria
-
 Angola
-
 Argentina
-
 Armenia
-
 Australia
-
 Austria
-
 Azerbaijan
-
 Bahamas
-
 Bahrain
-
 Bangladesh
-
 Belarus
-
 Belgium
-
 Bolivia
-
 Botswana
-
 Brazil
-
 Brunei
-
 Bulgaria
-
 Cambodia
-
 Cameroon
-
 Canada
-
 Chile
-
 China
-
 Colombia
-
 Congo
-
 Costa Rica
-
 Cote d'Ivoire
-
 Croatia
-
 Cuba
-
 Cyprus
-
 Czechia
-
 DR Congo
-
 Denmark
-
 Dominican Republic
-
 Ecuador
-
 Egypt
-
 El Salvador
-
 Estonia
-
 Eswatini
-
 Ethiopia
-
 Finland
-
 France
-
 Georgia
-
 Germany
-
 Ghana
-
 Greece
-
 Haiti
-
 Hong Kong
-
 Hungary
-
 India
-
 Indonesia
-
 Iran, Islamic republic
-
 Iraq
-
 Ireland
-
 Israel
-
 Italy
-
 Jamaica
-
 Japan
-
 Jordan
-
 Kazakhstan
-
 Kenya
-
 Korea
-
 Kuwait
-
 Kyrgyzstan
-
 Laos
-
 Latvia
-
 Lebanon
-
 Lesotho
-
 Libya
-
 Lithuania
-
 Luxembourg
-
 Madagascar
-
 Malaysia
-
 Malta
-
 Mauritius
-
 Mexico
-
 Moldova
-
 Mongolia
-
 Montenegro
-
 Morocco
-
 Mozambique
-
 Myanmar
-
 Namibia
-
 Nepal
-
 Netherlands
-
 New Zealand
-
 Nigeria
-
 North Macedonia
-
 Norway
-
 Oman
-
 Pakistan
-
 Palestine
-
 Panama
-
 Papua New Guinea
-
 Paraguay
-
 Peru
-
 Philippines
-
 Poland
-
 Portugal
-
 Puerto Rico
-
 Qatar
-
 Reunion
-
 Romania
-
 Rwanda
-
 Saudi Arabia
-
 Serbia
-
 Singapore
-
 Slovakia
-
 Slovenia
-
 Somalia
-
 South Africa
-
 Spain
-
 Sri Lanka
-
 Sweden
-
 Switzerland
-
 Syria
-
 Taiwan
-
 Tajikistan
-
 Tanzania
-
 Thailand
-
 Trinidad and Tobago
-
 Tunisia
-
 Turkey
-
 UAE
-
 Uganda
-
 Ukraine
-
 United Kingdom
-
United States
-
 Uruguay
-
 Uzbekistan
-
 Venezuela
-
 Vietnam
-
 Yemen
-
 Zambia
-
 Zimbabwe
- Forex
- Crypto












