

Bakkt stock slides further as seller pressure dominates near session lows

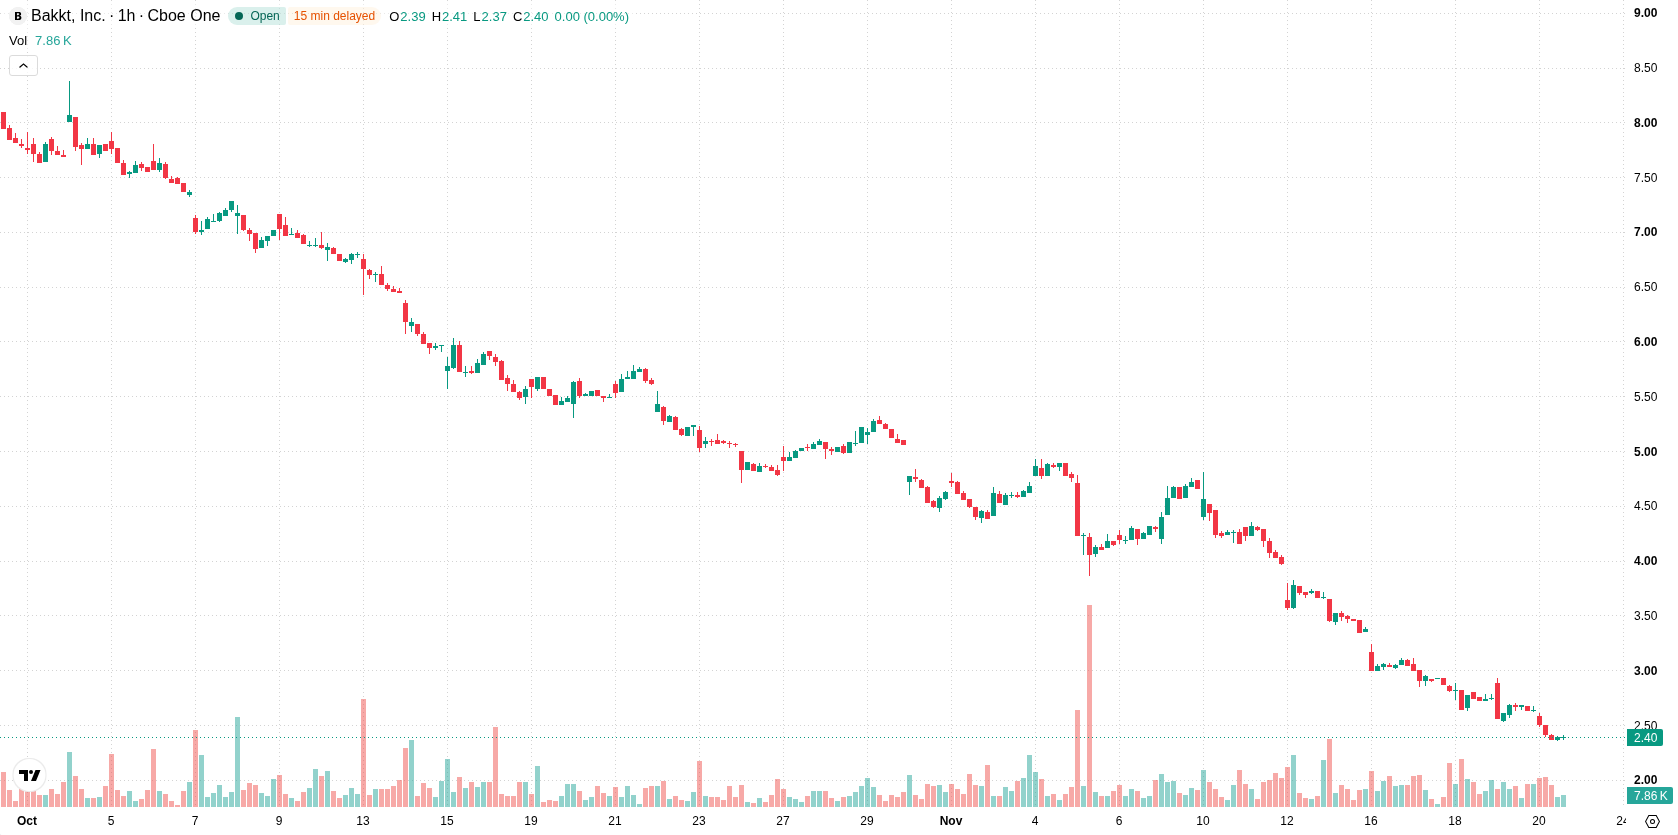
Bakkt Holdings, Inc. (BKKT) stock is trading at $2.38 after a decline of 10.04% for the session. The price is positioned below its key moving averages, reflecting continued downward momentum.
 2.63
3.24
Highlights
- BKKT/USD trades below all major moving averages, reflecting sustained downward momentum across multiple timeframes.
- Bearish indicators dominate with strong sell signals from MACD and ADX, and intraday control remains with sellers.
- Expected price range for the next few days is $2.06 to $2.70, with a low likelihood of a near-term upward reversal.
Oversold conditions as technical barriers reinforce selling pressure
On the H1 timeframe, the SMA-20 sits at $2.71 and the SMA-50 at $3.18, while on the D1 chart, the SMA-200 is at $8.07. BKKT is trading beneath all these moving averages, highlighting persistent downside pressure. The Ichimoku Kijun resistance is established at $2.77. Momentum indicators show that MACD and ADX are both giving strong sell signals. RSI, Stochastic RSI, and CCI are all firmly in oversold territory, suggesting selling momentum may be overextended but giving no clear sign of an imminent bounce. Bull/Bear Power remains negative at -0.13, confirming intraday bearish dominance, while the Awesome Oscillator is neutral. Today's price action was notably volatile, with a gap down and a close near session lows.
Rangebound outlook as volatility favors downside extension
Looking ahead to the next few trading days, the expected price band is $2.06 to $2.70, reflecting the typical volatility seen at current levels. Downside extension carries a much higher probability than an immediate rebound. If $2.06 is breached, further declines are likely, while any bullish reversal would require a move above resistance at $2.77. The base scenario is for price action to remain rangebound within these support and resistance boundaries.
Earlier, analysts noted that Bakkt remained under persistent bearish pressure with multiple technical signals supporting a downside bias. The current analysis reinforces this view, highlighting that any breach of the $2.06 support level could escalate further declines in the near term.









-
 Afghanistan
-
 Albania
-
 Algeria
-
 Angola
-
 Argentina
-
 Armenia
-
 Australia
-
 Austria
-
 Azerbaijan
-
 Bahamas
-
 Bahrain
-
 Bangladesh
-
 Belarus
-
 Belgium
-
 Bolivia
-
 Botswana
-
 Brazil
-
 Brunei
-
 Bulgaria
-
 Cambodia
-
 Cameroon
-
 Canada
-
 Chile
-
 China
-
 Colombia
-
 Congo
-
 Costa Rica
-
 Cote d'Ivoire
-
 Croatia
-
 Cuba
-
 Cyprus
-
 Czechia
-
 DR Congo
-
 Denmark
-
 Dominican Republic
-
 Ecuador
-
 Egypt
-
 El Salvador
-
 Estonia
-
 Eswatini
-
 Ethiopia
-
 Finland
-
 France
-
 Georgia
-
 Germany
-
 Ghana
-
 Greece
-
 Haiti
-
 Hong Kong
-
 Hungary
-
 India
-
 Indonesia
-
 Iran, Islamic republic
-
 Iraq
-
 Ireland
-
 Israel
-
 Italy
-
 Jamaica
-
 Japan
-
 Jordan
-
 Kazakhstan
-
 Kenya
-
 Korea
-
 Kuwait
-
 Kyrgyzstan
-
 Laos
-
 Latvia
-
 Lebanon
-
 Lesotho
-
 Libya
-
 Lithuania
-
 Luxembourg
-
 Madagascar
-
 Malaysia
-
 Malta
-
 Mauritius
-
 Mexico
-
 Moldova
-
 Mongolia
-
 Montenegro
-
 Morocco
-
 Mozambique
-
 Myanmar
-
 Namibia
-
 Nepal
-
 Netherlands
-
 New Zealand
-
 Nigeria
-
 North Macedonia
-
 Norway
-
 Oman
-
 Pakistan
-
 Palestine
-
 Panama
-
 Papua New Guinea
-
 Paraguay
-
 Peru
-
 Philippines
-
 Poland
-
 Portugal
-
 Puerto Rico
-
 Qatar
-
 Reunion
-
 Romania
-
 Rwanda
-
 Saudi Arabia
-
 Serbia
-
 Singapore
-
 Slovakia
-
 Slovenia
-
 Somalia
-
 South Africa
-
 Spain
-
 Sri Lanka
-
 Sweden
-
 Switzerland
-
 Syria
-
 Taiwan
-
 Tajikistan
-
 Tanzania
-
 Thailand
-
 Trinidad and Tobago
-
 Tunisia
-
 Turkey
-
 UAE
-
 Uganda
-
 Ukraine
-
 United Kingdom
-
United States
-
 Uruguay
-
 Uzbekistan
-
 Venezuela
-
 Vietnam
-
 Yemen
-
 Zambia
-
 Zimbabwe
- Forex
- Crypto












