Best Trading Strategies For Binary Options Without Indicators


Editorial Note: While we adhere to strict Editorial Integrity, this post may contain references to products from our partners. Here's an explanation for How We Make Money. None of the data and information on this webpage constitutes investment advice according to our Disclaimer.
Most effective naked binary options strategies:
Strategy 1. Pin bar and engulfing candle reversal strategy.
Strategy 2. Breakout strategy based on consolidation zones.
Strategy 3. Trendline breakout with price confirmation.
Strategy 4. Round number and psychological level trading.
Trading binary options without indicators is not guesswork. It’s about sharpening your ability to spot patterns that others overlook. No moving average will show you how a candle hesitates before breaking out, or how momentum slows just before a reversal. These are things you learn by feel, straight from the chart, not filtered through a tool. Clean trading means trusting your experience, your analysis, and your understanding of how the market moves, without relying on external confirmations.
Risk warning: Binary options trading is highly risky and may result in a total loss of funds. These speculative instruments often lack strong regulation, with over 80% of traders losing their capital. Invest only what you can afford to lose and seek professional advice.
Introduction to trading without indicators
Many traders clutter their charts with multiple indicators and end up confused. Naked binary options strategies take the opposite approach. By stripping the chart back to price alone, you learn to read how buyers and sellers interact in real time. This style isn’t about guessing, it’s about recognising where markets hesitate, accelerate and trap participants. When you develop that skill you can make faster decisions because you’re not waiting for indicator confirmation.
What does it mean to trade binary options with no indicators?
When you remove tools such as moving averages, RSI or MACD, you rely on raw candlestick data, horizontal support/resistance zones and trend lines. Decisions come from observing how candles form and react at key prices, not from waiting for an indicator to cross a threshold. This approach forces you to understand the mechanics of the market, who is in control, where orders are stacked and when momentum is fading.
What this involves:
Watching candle formations such as pin bars, engulfing candles, or dojis.
Drawing horizontal levels where price reacts frequently.
Using chart structure like higher highs or lower lows to define trend.
This style of trading focuses purely on price action, stripping away extra signals that may slow down decision-making.
The philosophy behind naked or non-indicator strategies
Let price be your leading indicator. Every technical indicator is derived from price. Many experienced traders therefore believe it’s more efficient to study price directly. Clean charts reduce mental noise, allowing you to concentrate on structure, speed and volatility rather than juggling multiple signals. Candlesticks tell a story about supply and demand; by focusing on them you develop the ability to anticipate rather than react. Simplicity also makes discipline easier, because there are fewer conflicting inputs to rationalise.
Why do many traders choose to avoid indicators
Indicators often produce delayed or contradictory signals, especially on short expiries like 5‑minute or 15‑minute binary options. Waiting for two or three indicators to agree can mean missing the move entirely. Non‑indicator binary options strategies avoid that problem by using price as the real‑time input. Clean charts sharpen your focus, help you spot levels where price hesitates and reduce dependence on tools that may repaint or deliver mixed messages.
Main reasons for avoiding indicators:
Faster decision-making without waiting for confirmation.
Cleaner charts that highlight price action.
Reduced reliance on tools that may repaint or change signals.
By focusing on price alone, traders aim to sharpen their reading of the market and gain more confidence in their own analysis.
Core elements of non-indicator trading
The backbone of trading binary options without indicators is learning to interpret price itself. Instead of plugging in oscillators or trend filters, traders rely on a handful of core techniques: price action, pattern recognition, support/resistance and volume context. Each element gives clues about who controls the market and where opportunities lie.

Price action as the foundation
Use swings to map the market. Identify whether price is making higher highs and higher lows (uptrend), lower highs and lower lows (downtrend) or moving sideways (range). Reading swings teaches you how momentum flows: surges followed by pauses, followed by continuation or reversal. Multi‑time‑frame analysis helps you align short‑term setups with the broader picture, for example, trading long on a 5‑minute chart when the 1‑hour trend is also rising.
Reading candlestick patterns and formations
Learn the language of candles. Pin bars, engulfing bars and inside bars are not random shapes, they reveal shifts in control. A long‑wick pin bar rejecting a support zone shows that sellers pushed price lower but buyers immediately stepped in, hinting at a reversal. Engulfing bars occur when a single candle completely consumes the prior candle’s body, signalling strong commitment by one side. Inside bars represent compression and often precede breakouts. Context is crucial: a pin bar in the middle of a choppy range means little, whereas a pin bar at a weekly low after a downtrend can mark a major turning point.
Support and resistance as primary tools
Let levels guide your entries. Mark horizontal zones where price has reacted repeatedly. These levels act as magnets and barriers, price often hesitates as orders get filled. Don’t clutter your chart with hundreds of lines; focus on obvious swing highs, swing lows, session opens and round numbers. Combine these with candle signals to build a non‑indicator binary options strategy: a bullish engulfing candle forming off a well‑tested support zone often leads to a high‑probability upside move.
Understanding volume contextually
Even though you’re avoiding indicators, raw volume bars (or tick volume in Forex) provide insight into commitment behind a move. A breakout candle on high volume suggests genuine participation, whereas a breakout on low volume warns that the move may fail. Watch how volume behaves at support or resistance: spikes often accompany reversals or strong continuations. When volume diverges from price, for instance, price makes a new high but volume is lower than previous highs, momentum may be waning.
Most effective naked binary options strategies
There are numerous ways to apply no indicator binary options strategies. Below are four high‑probability methods that rely exclusively on price action and key levels. Each strategy can be adapted to different assets and timeframes; the common thread is disciplined observation rather than signal‑chasing.
Pin bar and engulfing candle reversal strategy
Look for a long‑wick pin bar or an engulfing bar forming at a major support or resistance zone. The tail should stick out beyond the level, showing failed attempts by one side. Once the candle closes, enter in the direction opposite the rejected side. Managing expiry is crucial: choose an expiry one or two candles out on the timeframe you’re trading.
Ensure the pattern appears at a meaningful level, not in the middle of a range. Larger bodies and wicks carry more weight than tiny candles. Wait for the candle to close, acting mid‑bar invites false signals. On lower timeframes, use the first 15‑minute high and low of the session as anchor points to gauge where traps might occur.
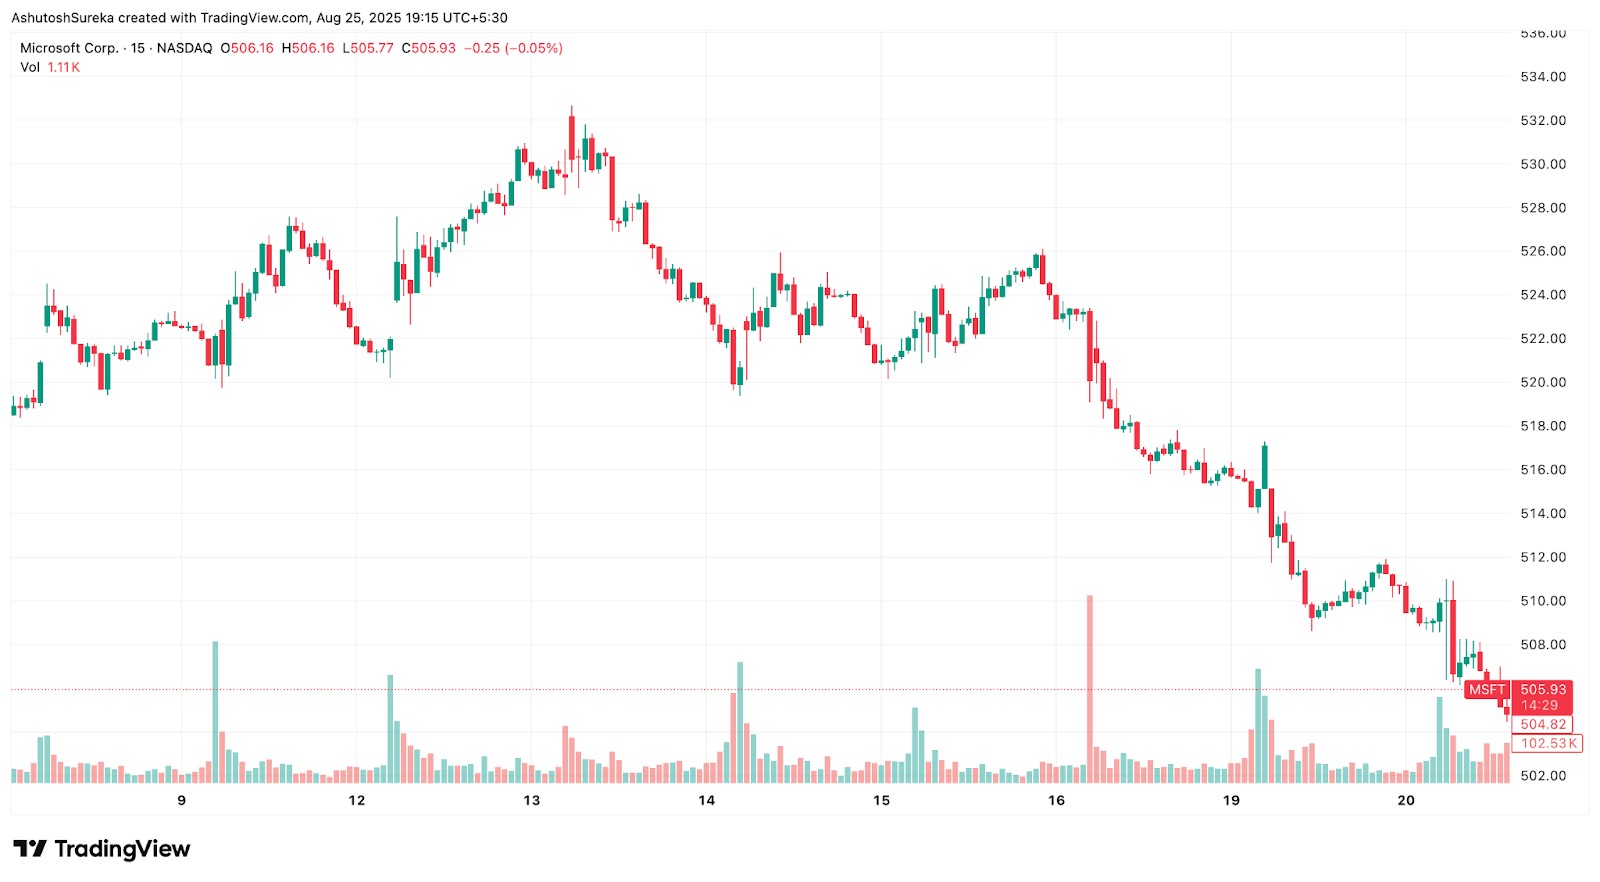
Breakout strategy based on consolidation zones
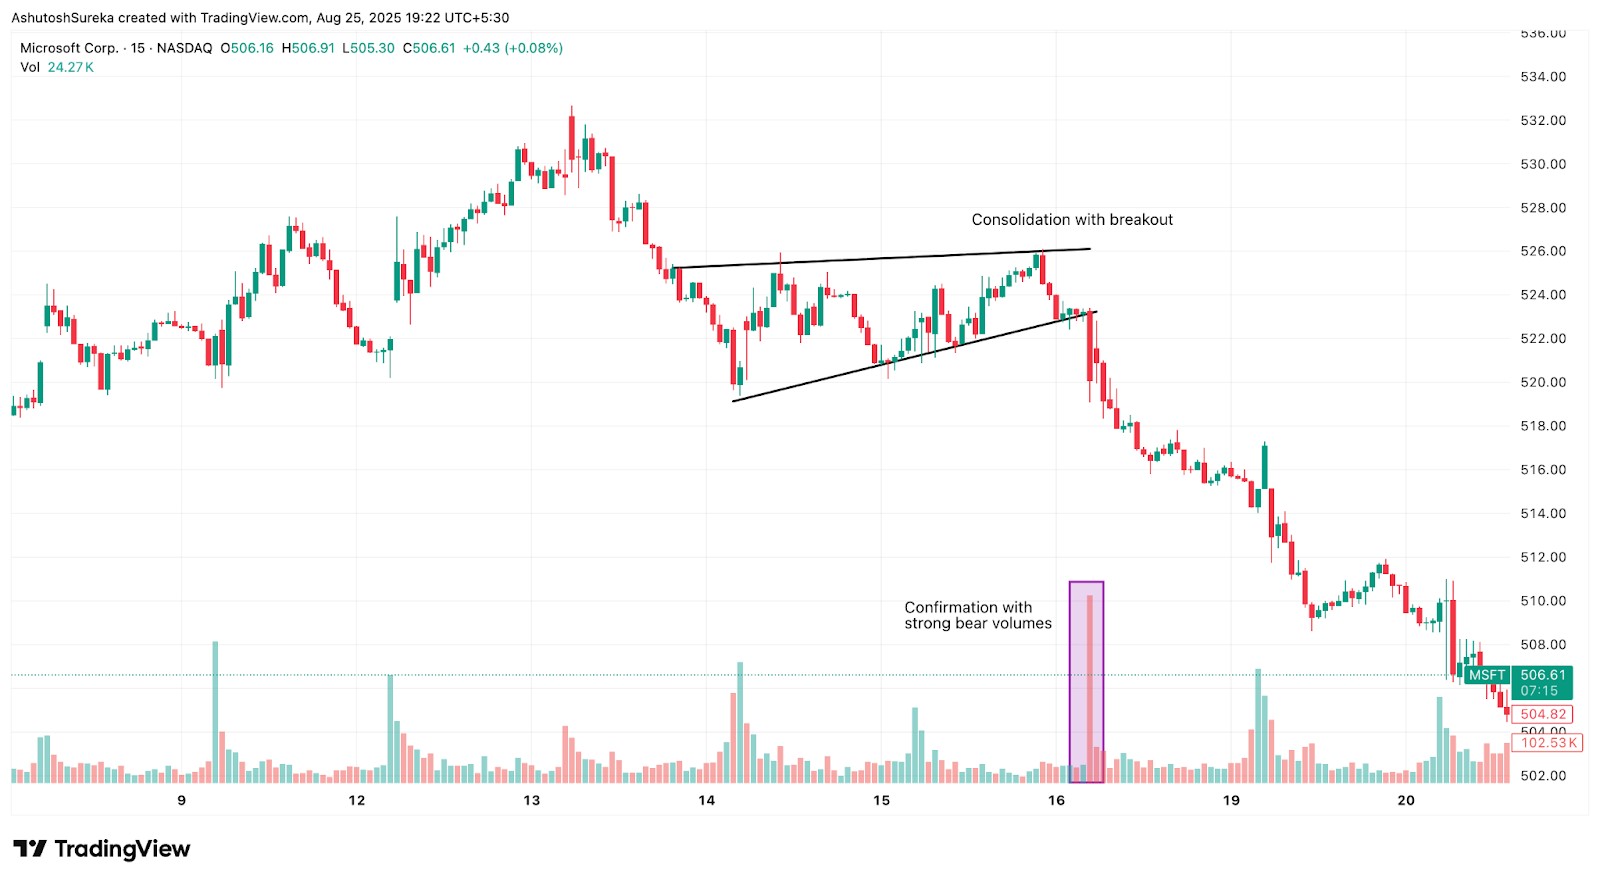
Markets tend to pause before making major moves, forming consolidation zones where price fluctuates within tight boundaries. These areas are especially useful for traders using non-indicator binary options strategies, as they reflect market indecision. When price eventually breaks out of these zones, it often results in strong momentum in a single direction. Such breakout patterns align well with binary trading, where accurate timing and direction are more important than long-term forecasts.
How to apply it:
Mark areas of support and resistance where price has repeatedly bounced.
Wait for a candle to close convincingly above or below the range.
Enter the trade in the direction of the breakout, using an expiry close to the breakout timeframe.
Don’t rush in on the first price spike. Wait for a solid breakout candle to confirm. Learn to recognize false breakouts, as premature entries are a common mistake among new binary traders.
Trendline breakout with price confirmation
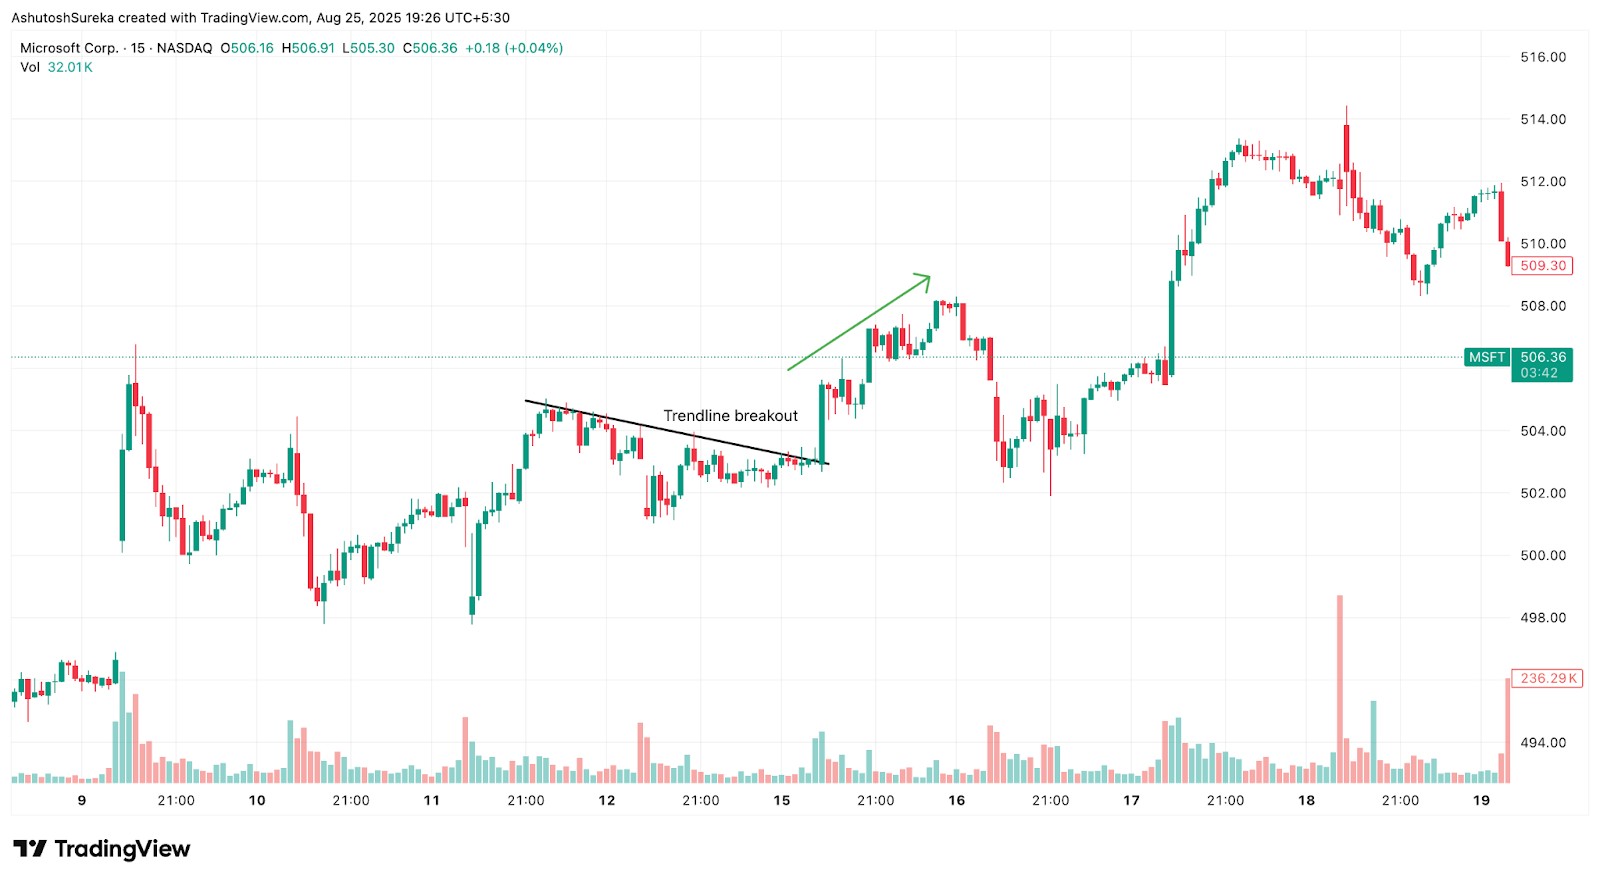
Trendlines are a simple yet powerful tool for identifying market behavior, especially when price consistently respects a sloped line. In many naked binary options strategies, a break of a trendline can signal a shift in control between buyers and sellers. Once the price closes beyond the trendline and continues moving in the same direction, it gives traders a clear signal to act, either on a trend reversal or a trend continuation.
How to apply it:
Draw a trendline by connecting higher lows in an uptrend or lower highs in a downtrend.
Look for a full candle close beyond the trendline.
Confirm the breakout with a follow-up candle moving in the same direction.
Only trust trendlines that connect at least three touchpoints. Avoid overly steep trendlines, as they are more likely to break prematurely.
Round number and psychological level trading
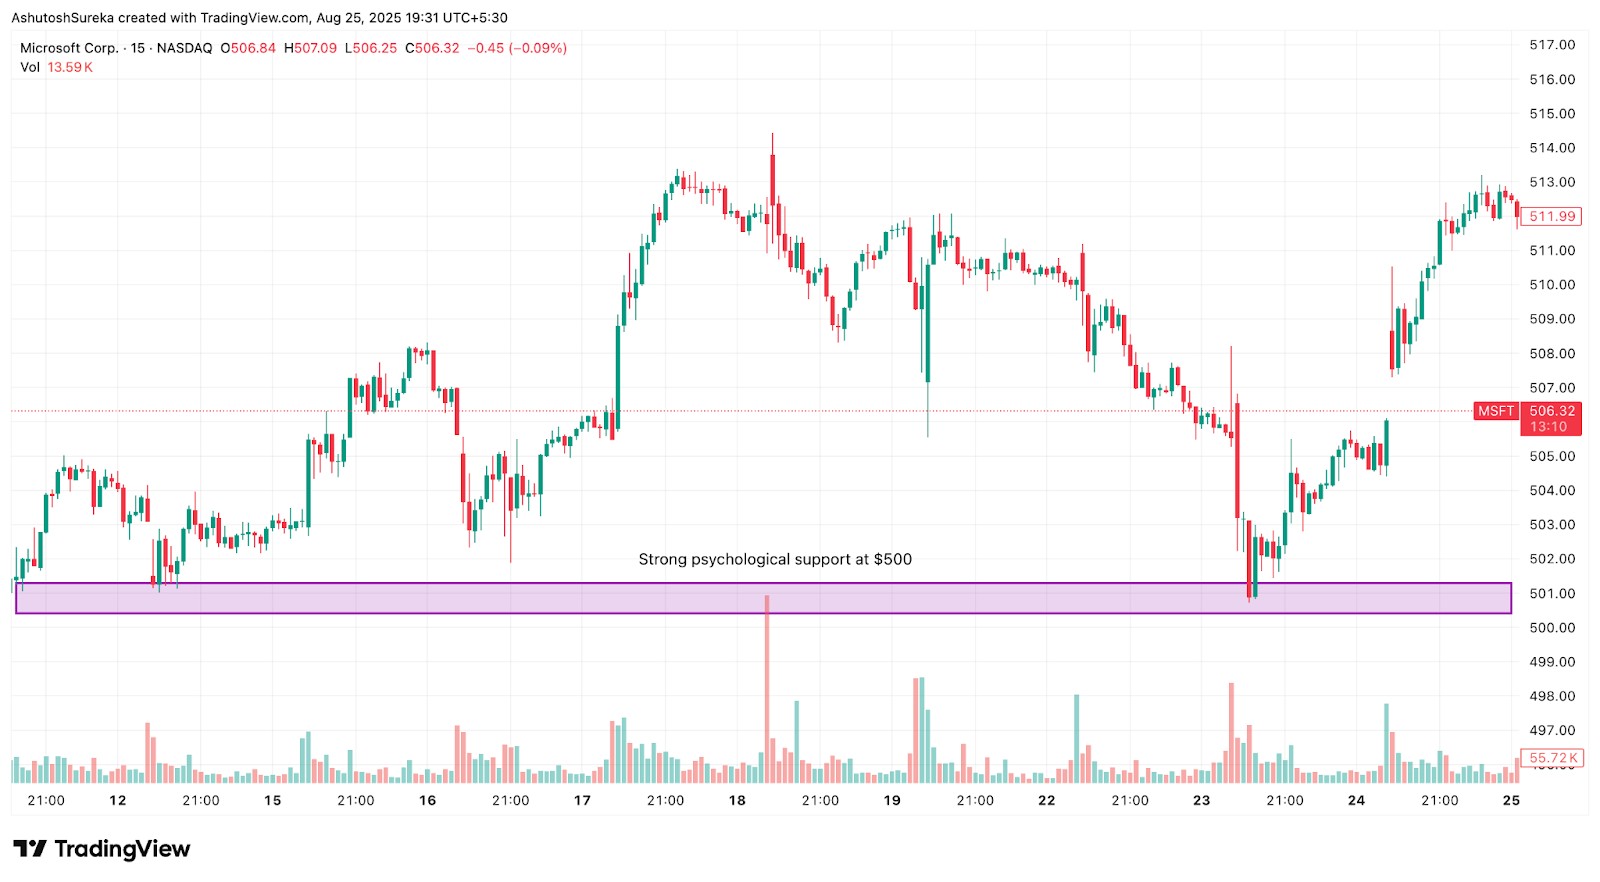
Levels like 1.2000 on EUR/USD carry psychological weight in trading. These round numbers often attract significant institutional activity, leading to strong market reactions. That’s why many traders using no-indicator methods consider them important. Non-indicator binary options strategies often incorporate these levels, as price frequently reacts to them in predictable ways. When combined with clear candlestick signals, these zones can create high-quality binary entry setups.
How to apply it:
Identify round numbers that price reacts to consistently.
Watch for price action like rejection candles or consolidations near those levels.
Trade in the direction of the reaction once the level holds or breaks clearly.
Focus on round numbers visible on larger time frames. Don’t rely on the level alone, always confirm with price behavior around it.
Best assets and conditions for no-indicator trading
A successful approach to trading binary options without indicators depends not only on the strategy but also on choosing the right markets and timing. No-indicator binary options strategies work best when price action is clean, volatility is balanced, and charts provide structure that can be read without confusion.
Which markets suit price action-only trading
Not every market is suitable for non-indicator binary options strategies. Price action needs liquidity and clear trends to give reliable signals.
Major Forex pairs such as EUR/USD, GBP/USD, and USD/JPY are strong choices because they have consistent movement and high volume.
Popular commodities like gold and crude oil also respond well to raw price levels, making them useful for naked binary options strategies.
Index markets like S&P 500 can work, though they often require longer expiries due to slower movement.
These assets are preferred because they avoid random spikes and give cleaner candlestick patterns.
Time of day and volatility considerations
Timing plays a big role in trading binary options without indicators. Price action works best when markets are active but not overly chaotic.
For Forex, the London and New York sessions offer strong but structured movement.
Stock markets provide the best setups in the first and last hour of trading when volume is highest.
Avoid low-liquidity hours such as the late Asian session, as candles become choppy and unreliable.
Balanced volatility ensures that no indicator binary options strategies can identify trends or reversals without being misled by sudden spikes.
Choosing assets with clean chart structures
A clean chart is vital for naked binary options strategies because it allows patterns like pin bars, engulfing candles, or breakout levels to stand out. Assets with messy, unpredictable price movement make it difficult to rely on price alone.
Tips for asset selection:
Pick assets with fewer wicks and a smoother candle body.
Avoid pairs with frequent gaps or irregular spikes.
Favor markets with consistent reaction to support and resistance.
By focusing on clean charts, traders can apply non-indicator binary options strategies with higher confidence and fewer false signals.
| Foundation year | Min. deposit | Min. trade size | Min. Payout (%) | Max. Payout (%) | Demo | Copy trading | Open an account | |
|---|---|---|---|---|---|---|---|---|
| 2013 | 5 | 1 | 17 | 95 | Yes | No | Go to broker Your capital is at risk. |
|
| 2019 | 10 | 1 | 60 | 90 | Yes | No | Go to broker Your capital is at risk.
|
|
| 2009 | 250 | 1 | No | 100 | Yes | No | Study review | |
| 2017 | 5 | 1 | 50 | 128 | Yes | Yes | Go to broker Your capital is at risk. |
|
| 2019 | 10 | 1 | 20 | 98 | Yes | No | Go to broker Your capital is at risk. |
Mastering candle-momentum traps and key time rejections in binary options

Most traders underestimate the power of candle-momentum traps in binary options. One specialized tactic is identifying false momentum continuation patterns around psychological round numbers (like 1.2000 or 18000). Price often spikes with a long bullish or bearish candle to trigger retail breakout traders, only to reverse sharply in the next 1–2 candles. Instead of chasing the breakout, a naked trader anticipates the trap: by watching volume divergence and exhaustion wicks, they enter binary trades against the candle’s close for short expiry times. It’s counterintuitive, but brutally effective, especially in 1m and 5m charts.
Another high-probability technique is “key time rejections.” Certain hours in the market, especially during overlap sessions (like 12:30 to 14:00 UTC in Forex), often act as inflection points where price reacts strongly to institutional flow. Naked traders who mark previous daily highs/lows and watch how candles behave at those levels during these “hot zones” can catch razor-sharp reversals without a single indicator. Pairing this with engulfing candle confirmation can build a sniper-like binary strategy, zero indicators, just raw market rhythm.
Conclusion
Trading without indicators is not just about having a clean chart. It is about cutting the clutter so your brain starts catching the real signals. You will notice that markets breathe. They do not bounce randomly. Price shows patterns if you just pay attention. Candles talk if you know the language. Small pauses reveal big things. If you are serious about mastering the craft, learning this way might change your whole game.
FAQs
How many trades per day is ideal in no-indicator binary trading?
In no-indicator binary trading, placing 2 to 5 quality trades per day is ideal. Focus on strong visual setups and market structure rather than forcing frequent entries.
Should I use news analysis when trading without indicators?
Yes, news analysis is essential when trading without indicators, as price can become erratic during high-impact events. Avoid trading during news releases unless your strategy is built to handle volatility.
What timeframe works best for visual setups in binary options?
The 5-minute and 15-minute timeframes are best for visual setups, offering enough price structure to read trends and reversals clearly without excessive noise.
How do I backtest a naked binary strategy without indicators?
Backtest by reviewing historical price charts, identifying your visual entry patterns, and logging each hypothetical trade’s outcome. Focus on consistency, reaction zones, and candlestick behavior across different market conditions.
Editors' Top Picks and Insights

Hunting crypto owners: Why criminals have gone offline

BitMEX is shutting down: Why Trump could not save the exchange

Do governments need crypto workers?

Brent nears $100: Why oil prices are rising

Gram Wallet launch: Can Telegram bring crypto to the masses?

AI without limits: How dangerous are neural networks?
Related Articles
Team that worked on the article
Mikhail Vnuchkov joined Traders Union as an author in 2020. He began his professional career as a journalist-observer at a small online financial publication, where he covered global economic events and discussed their impact on the segment of financial investment, including investor income.
Dan Blystone began his trading career in 1998 as an arbitrage clerk on the floor of the Chicago Mercantile Exchange (CME). He later traded bond and Eurex futures at proprietary firms such as Altea Trading, gaining valuable experience in high-frequency trading and risk management.
Chinmay Soni is a financial analyst with more than 5 years of experience in working with stocks, Forex, derivatives, and other assets. As a founder of a boutique research firm and an active researcher, he covers various industries and fields, providing insights backed by statistical data.
Risk management is a risk management model that involves controlling potential losses while maximizing profits. The main risk management tools are stop loss, take profit, calculation of position volume taking into account leverage and pip value.
Volatility refers to the degree of variation or fluctuation in the price or value of a financial asset, such as stocks, bonds, or cryptocurrencies, over a period of time. Higher volatility indicates that an asset's price is experiencing more significant and rapid price swings, while lower volatility suggests relatively stable and gradual price movements.
Index in trading is the measure of the performance of a group of stocks, which can include the assets and securities in it.
Copy trading is an investing tactic where traders replicate the trading strategies of more experienced traders, automatically mirroring their trades in their own accounts to potentially achieve similar results.
An investor is an individual, who invests money in an asset with the expectation that its value would appreciate in the future. The asset can be anything, including a bond, debenture, mutual fund, equity, gold, silver, exchange-traded funds (ETFs), and real-estate property.

-
 Afghanistan
-
 Albania
-
 Algeria
-
 Angola
-
 Argentina
-
 Armenia
-
 Australia
-
 Austria
-
 Azerbaijan
-
 Bahamas
-
 Bahrain
-
 Bangladesh
-
 Belarus
-
 Belgium
-
 Bolivia
-
 Botswana
-
 Brazil
-
 Brunei
-
 Bulgaria
-
 Cambodia
-
 Cameroon
-
 Canada
-
 Chile
Chile
-
 China
China
-
 Colombia
-
 Congo
Congo
-
 Costa Rica
-
 Cote d'Ivoire
-
 Croatia
-
 Cuba
Cuba
-
 Cyprus
-
 Czechia
-
 DR Congo
-
 Denmark
-
 Dominican Republic
-
 Ecuador
-
 Egypt
Egypt
-
 El Salvador
-
 Estonia
-
 Eswatini
-
 Ethiopia
-
 Finland
-
 France
-
 Georgia
-
 Germany
-
 Ghana
Ghana
-
 Greece
-
 Haiti
Haiti
-
 Hong Kong
-
 Hungary
-
 India
India
-
 Indonesia
-
 Iran, Islamic republic
-
 Iraq
Iraq
-
 Ireland
-
 Israel
-
 Italy
Italy
-
 Jamaica
-
 Japan
Japan
-
 Jordan
-
 Kazakhstan
-
 Kenya
Kenya
-
 Korea
Korea
-
 Kuwait
-
 Kyrgyzstan
-
 Laos
Laos
-
 Latvia
-
 Lebanon
-
 Lesotho
-
 Libya
Libya
-
 Lithuania
-
 Luxembourg
-
 Madagascar
-
 Malaysia
-
 Malta
Malta
-
 Mauritius
-
 Mexico
-
 Moldova
-
 Mongolia
-
 Montenegro
-
 Morocco
-
 Mozambique
-
 Myanmar
-
 Namibia
-
 Nepal
Nepal
-
 Netherlands
-
 New Zealand
-
 Nigeria
-
 North Macedonia
-
 Norway
-
 Oman
Oman
-
 Pakistan
-
 Palestine
-
 Panama
-
 Papua New Guinea
-
 Paraguay
-
 Peru
Peru
-
 Philippines
-
 Poland
-
 Portugal
-
 Puerto Rico
-
 Qatar
Qatar
-
 Reunion
-
 Romania
-
 Rwanda
-
 Saudi Arabia
-
 Serbia
-
 Singapore
-
 Slovakia
-
 Slovenia
-
 Somalia
-
 South Africa
-
 Spain
Spain
-
 Sri Lanka
-
 Sweden
-
 Switzerland
-
 Syria
Syria
-
 Taiwan
-
 Tajikistan
-
 Tanzania
-
 Thailand
-
 Trinidad and Tobago
-
 Tunisia
-
 Turkey
-
 UAE
UAE
-
 Uganda
-
 Ukraine
-
 United Kingdom
-
United States
-
 Uruguay
-
 Uzbekistan
-
 Venezuela
-
 Vietnam
-
 Yemen
Yemen
-
 Zambia
-
 Zimbabwe
- Forex
- Crypto
