How To Use The Parabolic SAR Strategy For Binary Options Trading


Editorial Note: While we adhere to strict Editorial Integrity, this post may contain references to products from our partners. Here's an explanation for How We Make Money. None of the data and information on this webpage constitutes investment advice according to our Disclaimer.
The best way to use Parabolic SAR in binary options is not by chasing every flip of the dots but by noticing the hesitation that comes just before the switch. When price slows and the dots are about to move to the other side, that pause is often the real entry signal. In fast expiries, timing matters more than confirmation. SAR works best when combined with clear momentum or support and resistance, helping you act before the crowd reacts.
Many people treat Parabolic SAR like a simple go or stop sign, but that is not how it works best. In binary options, where trades last seconds, you cannot just follow dots. The key is watching what happens before the flip. The SAR becomes powerful when it reflects a moment of doubt in the market, not just a shift in price direction.
Risk warning: Binary options trading is highly risky and may result in a total loss of funds. These speculative instruments often lack strong regulation, with over 80% of traders losing their capital. Invest only what you can afford to lose and seek professional advice.
Understanding parabolic SAR in binary trading
The parabolic SAR method is one of the simplest ways for traders to follow trends and time entries. The SAR, which stands for “stop and reverse,” plots small dots on the chart that shift as price direction changes. Traders often apply a parabolic SAR strategy for binary options to capture short-term movements, making it a favorite tool for beginners and experienced traders alike.

What is the parabolic SAR indicator?
The parabolic SAR indicator works by placing dots above or below the price to show the likely direction of the market:
when dots are below the price, it signals bullish conditions;
when dots are above the price, it signals bearish conditions;
a flip of dots from one side to the other indicates a possible change in direction.
This design makes SAR a visual and easy-to-use system, especially in fast-paced binary options markets.
Why traders use parabolic SAR for short-term trades
Binary options often involve expiry times ranging from one minute to fifteen minutes. The parabolic SAR trading strategy suits these short horizons because it reacts quickly to price shifts.
| Feature | Benefit for binary traders |
|---|---|
| Clear dot placement | Provides instant visual trend direction |
| Fast reaction | Captures short bursts of momentum |
| Simplicity | Easy to read without complex calculations |
This makes SAR one of the most effective tools when tuned for lower timeframes.
How parabolic SAR helps identify entry and exit points
The SAR is designed not only to show direction but also to mark entry and exit points. Traders using a parabolic SAR strategy guide often rely on dot flips to decide when to open or close trades.
For example, if dots switch from above price to below price, it can signal a call option entry. Conversely, if dots move from below to above, it can signal a put option entry. These parabolic SAR signals for binary options trading provide clear, mechanical setups without the need for subjective interpretation.
When combined with other filters like support, resistance, or momentum indicators, the parabolic SAR strategy for binary options becomes even more reliable, helping traders avoid false trades in choppy markets.
Core principles of the parabolic SAR strategy
The parabolic SAR strategy for binary options works on the idea that price trends are easier to follow when visual signals guide entries and exits. Traders rely on dot placements, reversals, and the sensitivity of the settings to make quick decisions. Understanding these principles is essential before applying any parabolic SAR trading strategy in live markets.
Interpreting dot placements above and below the price
The parabolic SAR indicator places dots either above or below the price. This is the core feature that shows direction:
dots below the price suggest an uptrend and often support call option entries;
dots above the price suggest a downtrend and favor put option entries.
When dots stay consistently on one side, traders treat this as confirmation that the current trend is valid. These visual cues make it one of the simplest systems for beginners.
SAR reversals and trend confirmation signals
One of the most powerful parabolic SAR signals traders watch for is the flip, where dots jump from above to below or vice versa. This shift signals a potential trend change.
| Signal type | Dot movement | Typical action in binary trading |
|---|---|---|
| Bullish reversal | Dots flip from above price to below | Consider call options |
| Bearish reversal | Dots flip from below price to above | Consider put options |
In practice, traders often combine these reversals with other tools, such as moving averages or RSI, to confirm the trend change and reduce false entries.
How lag and sensitivity affect strategy success
Any parabolic SAR strategy guide must also account for the fact that the indicator lags during strong market moves. Because the dots trail behind price, signals sometimes appear late. This is a trade-off between sensitivity and reliability.
High sensitivity (shorter settings): dots flip quickly, capturing small reversals but creating more false signals.
Low sensitivity (longer settings): dots flip slowly, filtering noise but sometimes missing early entries.
For the parabolic SAR approach for binary options, traders typically adjust settings to match their timeframe, balancing the need for speed with the need to avoid unnecessary trades.
Best binary options strategies using parabolic SAR
The parabolic SAR strategy for binary options can be adapted to multiple market conditions. Traders use it for following trends, spotting pullbacks, trading breakouts, and even managing range-bound markets. These variations make the parabolic SAR trading strategy versatile across different expiry times and assets.
Trend-following SAR signal strategy
This is the most common way to apply the parabolic SAR in binary options trading. Traders simply follow the direction of the dots:
if dots stay below price, call options are considered;
if dots remain above the price, put options are taken.

This straightforward strategy works best in strong, clean trends where SAR dots provide consistent guidance without frequent flips.
SAR with pullback confirmation entries
In many markets, trends pause before continuing. The parabolic SAR indicator can be paired with pullbacks to create stronger entries.
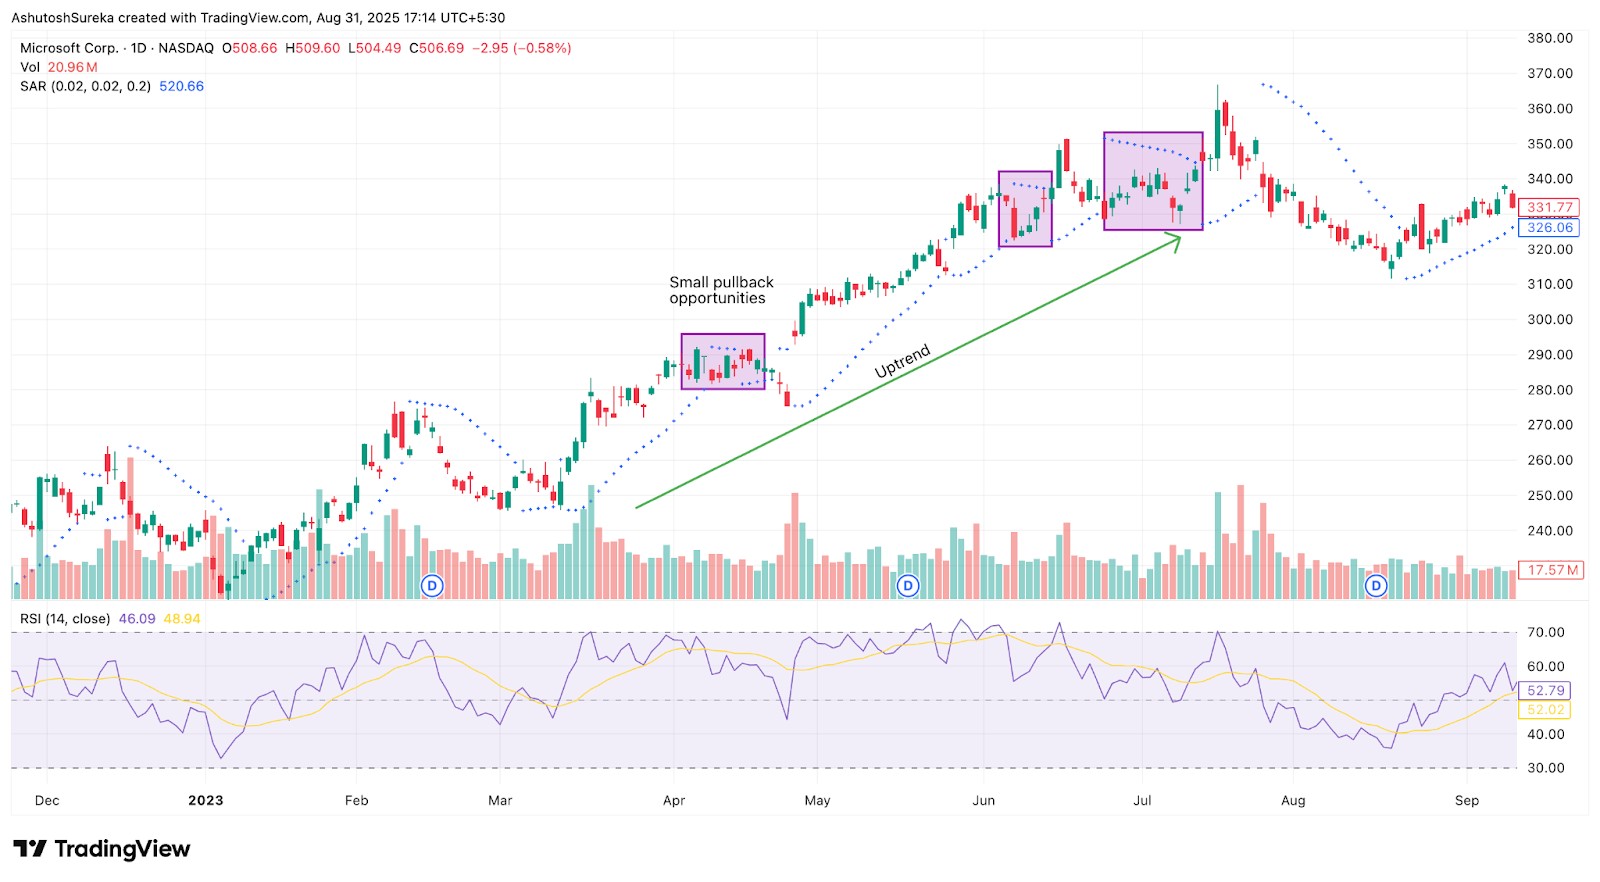
For example, in an uptrend, traders wait for a short pullback toward support and then confirm the continuation with dots below the price. This reduces false starts and avoids entering right before a temporary retracement.
High-volatility breakout SAR strategy
During news events or sudden bursts of volatility, the parabolic SAR signals binary options can highlight breakout opportunities. When dots flip direction at the same time as price breaks a support or resistance level, the signal becomes stronger.

| Condition | SAR signal | Typical binary action |
|---|---|---|
| Break above resistance | Dots flip below price | Consider call options |
| Break below support | Dots flip above price | Consider put options |
This style is effective in high-energy sessions like London–New York overlaps but requires discipline to avoid false moves.
Strategy for range-bound markets using SAR
Even in sideways markets, the parabolic SAR strategy can be adapted. Traders use the stop-and-reverse nature of SAR to switch between calls and puts inside a defined range:
when the price nears resistance and SAR dots flip above, a put option is considered;
when the price approaches support and the SAR dots flip below, a call option is taken.
While this method works in consolidation, it requires confirmation from support and resistance zones to avoid whipsaws.
Combining parabolic SAR with other indicators
While the parabolic SAR strategy for binary options is simple and effective, pairing it with other tools helps reduce false entries and improve accuracy. Many traders enhance their parabolic SAR trading strategy by using momentum indicators, trend filters, and volume analysis to confirm parabolic SAR signals for binary options before committing to a trade.
RSI and SAR combination for filtering entries
The Relative Strength Index (RSI) is one of the most popular ways to filter signals from the parabolic SAR:
if SAR dots flip below price (bullish) while RSI is above 50, the call signal is stronger;
if SAR dots flip above price (bearish) while RSI is below 50, the put signal gains confirmation.
This combination prevents traders from taking SAR signals that occur in weak or indecisive markets.
Using MACD to validate SAR trend shifts
MACD is another tool that pairs well with the parabolic SAR indicator. The SAR identifies the potential trend shift, while MACD validates whether momentum supports the move.
| SAR signal | MACD confirmation | Trade implication |
|---|---|---|
| Dots flip below price | MACD histogram above zero | Stronger call setup |
| Dots flip above price | MACD histogram below zero | Stronger put setup |
This dual approach improves the reliability of reversals by ensuring both trend and momentum agree.
Parabolic SAR and moving averages crossover setups
Moving averages act as a trend filter when used with SAR. For example, if the 50-period moving average is sloping upward, traders only take call entries when SAR dots flip below price. Conversely, when the average is sloping downward, SAR flips above price are treated as valid put entries.
This crossover-style filter ensures the parabolic SAR aligns with the broader market flow, avoiding trades against the main trend.
Volume filters to support SAR signals
Volume is often overlooked, but it can add significant weight to parabolic SAR trading strategy setups. If SAR dots flip direction and the move is backed by rising volume, the signal becomes more credible. On the other hand, SAR reversals during low-volume periods are less reliable.
By combining SAR with volume filters, traders ensure that entries have sufficient market participation to follow through, reducing the risk of false trades.
Using the Parabolic SAR strategy requires platforms that deliver accurate trend tracking and responsive charting. The table below showcases brokers equipped with the technical tools to support this style of trading.
| Currency pairs | Crypto | Stocks | Min. deposit, $ | Max. leverage | TradingView | MT5 | cTrader | Regulation | TU overall score | Open an account | |
|---|---|---|---|---|---|---|---|---|---|---|---|
| 120 | Yes | Yes | 1 | 1:30 | Yes | Yes | Yes | CNMV | 5.35 | Study review | |
| 90 | Yes | Yes | No | 1:500 | Yes | Yes | Yes | ASIC, FCA, DFSA, BaFin, CMA, SCB, CySec | 9.25 | Go to broker Your capital is at risk.
|
|
| 90 | Yes | Yes | 1 | 1:500 | Yes | Yes | Yes | ASIC, VFSC, FSA | 9.2 | Go to broker Your capital is at risk. |
|
| 70 | Yes | Yes | 100 | 1:500 | No | Yes | Yes | FCA, CYSEC, FSCA, SCB, FSA (Seychelles) | 9 | Go to broker Your capital is at risk. |
|
| 61 | Yes | Yes | 200 | 1:5000 | Yes | Yes | Yes | FSA (Seychelles) | 8.25 | Go to broker Your capital is at risk. |
When the SAR flips before the crowd notices

Most people wait for the SAR to flip, thinking it confirms the trend, but it can actually be your first sign of weakness. If it changes right after price struggles to push higher or volume dries up, you might be watching the start of a stall, not a trend. That short pause is your chance to take a smart trade. Especially in binary options, where you are focused on minutes, not hours, spotting that moment before others react can change your whole game.
Also, do not use SAR in every kind of market. When the price keeps bouncing in both directions, the flips mean nothing. The better way is to first look at a bigger chart and ask if the price is really moving with purpose. If the bigger picture makes sense, only then look closer and use SAR to time your entry. This one habit can stop you from taking trades just because the dots told you so.
Conclusion
Parabolic SAR is not here to tell you where the trend is going. It shows you when the crowd starts hesitating. If you want it to work in binary options, use it to spot tension, not just trend shifts. The moment price stumbles around a SAR flip, that is your clue. Use it to read what others miss, and your trades will stop feeling random.
FAQs
Can parabolic SAR be used for 1-minute binary trades?
Yes, Parabolic SAR can be used for 1-minute binary trades, but it often gives frequent signals that may be less reliable due to market noise. It works better when price is trending clearly on lower timeframes.
Does SAR work during major market news events?
No, Parabolic SAR is less effective during news events because sudden volatility can cause frequent signal reversals. It's safer to avoid SAR-based trades during unpredictable market conditions.
Is SAR more reliable on Forex or crypto binary options?
SAR is generally more reliable on Forex due to smoother price movement and higher liquidity. Crypto markets tend to be more volatile, which can lead to more false signals with SAR.
What mistakes do beginners make with SAR in binary options?
Beginners often enter trades without confirming the trend, rely solely on SAR dots, or trade in choppy markets. Not combining SAR with price action or other filters can lead to poor decision-making.
Editors' Top Picks and Insights

Brent nears $100: Why oil prices are rising

Gram Wallet launch: Can Telegram bring crypto to the masses?

AI without limits: How dangerous are neural networks?

Worldcoin on Wall Street: From iris scans to ETF

Mark Cuban's wealth philosophy: Why stocks matter more than salary or crypto

Dangerous but indispensable: Why the crypto market needs bridges
Related Articles
Team that worked on the article
Anton Kharitonov is an active trader and analyst. He employs both short- and long-term trading strategies, primarily based on fundamental factors, supported by technical indicators and intermarket analysis.
Dan Blystone began his trading career in 1998 as an arbitrage clerk on the floor of the Chicago Mercantile Exchange (CME). He later traded bond and Eurex futures at proprietary firms such as Altea Trading, gaining valuable experience in high-frequency trading and risk management.
Chinmay Soni is a financial analyst with more than 5 years of experience in working with stocks, Forex, derivatives, and other assets. As a founder of a boutique research firm and an active researcher, he covers various industries and fields, providing insights backed by statistical data.
Binary options trading is a financial trading method where traders speculate on the price movement of various assets, such as stocks, currencies, or commodities, by predicting whether the price will rise or fall within a specified time frame, often as short as a few minutes. Unlike traditional trading, binary options have only two possible outcomes: a fixed payout if the trader's prediction is correct or a loss of the invested amount if the prediction is wrong.
Risk management is a risk management model that involves controlling potential losses while maximizing profits. The main risk management tools are stop loss, take profit, calculation of position volume taking into account leverage and pip value.
Day trading involves buying and selling financial assets within the same trading day, with the goal of profiting from short-term price fluctuations, and positions are typically not held overnight.
Volatility refers to the degree of variation or fluctuation in the price or value of a financial asset, such as stocks, bonds, or cryptocurrencies, over a period of time. Higher volatility indicates that an asset's price is experiencing more significant and rapid price swings, while lower volatility suggests relatively stable and gradual price movements.
Options trading is a financial derivative strategy that involves the buying and selling of options contracts, which give traders the right (but not the obligation) to buy or sell an underlying asset at a specified price, known as the strike price, before or on a predetermined expiration date. There are two main types of options: call options, which allow the holder to buy the underlying asset, and put options, which allow the holder to sell the underlying asset.

-
 Afghanistan
-
 Albania
-
 Algeria
-
 Angola
-
 Argentina
-
 Armenia
-
 Australia
-
 Austria
-
 Azerbaijan
-
 Bahamas
-
 Bahrain
-
 Bangladesh
-
 Belarus
-
 Belgium
-
 Bolivia
-
 Botswana
-
 Brazil
-
 Brunei
-
 Bulgaria
-
 Cambodia
-
 Cameroon
-
 Canada
-
 Chile
Chile
-
 China
China
-
 Colombia
-
 Congo
Congo
-
 Costa Rica
-
 Cote d'Ivoire
-
 Croatia
-
 Cuba
Cuba
-
 Cyprus
-
 Czechia
-
 DR Congo
-
 Denmark
-
 Dominican Republic
-
 Ecuador
-
 Egypt
Egypt
-
 El Salvador
-
 Estonia
-
 Eswatini
-
 Ethiopia
-
 Finland
-
 France
-
 Georgia
-
 Germany
-
 Ghana
Ghana
-
 Greece
-
 Haiti
Haiti
-
 Hong Kong
-
 Hungary
-
 India
India
-
 Indonesia
-
 Iran, Islamic republic
-
 Iraq
Iraq
-
 Ireland
-
 Israel
-
 Italy
Italy
-
 Jamaica
-
 Japan
Japan
-
 Jordan
-
 Kazakhstan
-
 Kenya
Kenya
-
 Korea
Korea
-
 Kuwait
-
 Kyrgyzstan
-
 Laos
Laos
-
 Latvia
-
 Lebanon
-
 Lesotho
-
 Libya
Libya
-
 Lithuania
-
 Luxembourg
-
 Madagascar
-
 Malaysia
-
 Malta
Malta
-
 Mauritius
-
 Mexico
-
 Moldova
-
 Mongolia
-
 Montenegro
-
 Morocco
-
 Mozambique
-
 Myanmar
-
 Namibia
-
 Nepal
Nepal
-
 Netherlands
-
 New Zealand
-
 Nigeria
-
 North Macedonia
-
 Norway
-
 Oman
Oman
-
 Pakistan
-
 Palestine
-
 Panama
-
 Papua New Guinea
-
 Paraguay
-
 Peru
Peru
-
 Philippines
-
 Poland
-
 Portugal
-
 Puerto Rico
-
 Qatar
Qatar
-
 Reunion
-
 Romania
-
 Rwanda
-
 Saudi Arabia
-
 Serbia
-
 Singapore
-
 Slovakia
-
 Slovenia
-
 Somalia
-
 South Africa
-
 Spain
Spain
-
 Sri Lanka
-
 Sweden
-
 Switzerland
-
 Syria
Syria
-
 Taiwan
-
 Tajikistan
-
 Tanzania
-
 Thailand
-
 Trinidad and Tobago
-
 Tunisia
-
 Turkey
-
 UAE
UAE
-
 Uganda
-
 Ukraine
-
 United Kingdom
-
United States
-
 Uruguay
-
 Uzbekistan
-
 Venezuela
-
 Vietnam
-
 Yemen
Yemen
-
 Zambia
-
 Zimbabwe
- Forex
- Crypto
