Convergence And Divergence: Everything You Need To Know


Editorial Note: While we adhere to strict Editorial Integrity, this post may contain references to products from our partners. Here's an explanation for How We Make Money. None of the data and information on this webpage constitutes investment advice according to our Disclaimer.
What is divergence and convergence:
Divergence is the difference between the price movement and the indicator readings. It indicates a possible weakening of the current trend or its reversal.
Convergence is the convergence of the price and indicator dynamics. It confirms the strength of the trend and the likelihood of its continuation.
Identifying price action signals through the lens of convergence and divergence is a common approach in market analysis. It involves comparing the movement of technical indicators with actual price trends to detect potential turning points. Traders look for mismatches between these readings to anticipate reversals or trend continuation.
This technique is accessible to both experienced traders and beginners, though success largely depends on interpreting the signals correctly. Misreading patterns or acting on false signals can lead to poor decisions and potential losses.
In our analysis, we explored the fundamentals of how convergence and divergence appear on charts and reviewed practical examples to show how they work in real trading conditions. Understanding these patterns can significantly improve your ability to read market behavior and respond with greater confidence.
What are divergence and convergence?
The terms convergence and divergence refer to how two related data series move relative to one another. In finance this usually means the relationship between market prices and some other signal, an indicator, another asset, market sentiment or even macro‑economic data.
Divergence. When the price of an asset is moving in one direction while an associated indicator, sentiment gauge or correlated market begins to move the opposite way, the signals diverge. Divergence is an early warning that the current trend may be slowing or that the forces driving it have changed. For example, Divergence in an uptrend occurs when price makes a higher high but the indicator does not, and such disagreement often precedes a retracement rather than an immediate reversal. Divergences are therefore signs of potential change, no t guarantees of a turning point.
Convergence. Convergence is the opposite condition, price and a second data series are moving together, confirming one another. It suggests that the underlying momentum is healthy and the trend may continue. Macro research from EFG Asset Management observes that when investment‑grade corporate bond spreads in developed markets and sovereign spreads in emerging markets move together, it indicates broad agreement on risk premiums and often precedes more stable conditions.
These definitions apply across disciplines. In mathematics, series converge or diverge; in biology, species evolve away from or towards each other. In trading, convergence and divergence signals can come from price oscillators, cross‑asset correlations, volume data, sentiment indicators and macro‑economic relationships. The ability to spot them helps traders gauge whether market forces are aligned or conflicting.
| Aspect | Divergence | Convergence |
|---|---|---|
| Definition | Price and indicator move in opposite directions | Price and indicator move in the same direction |
| Typical Interpretation | Early warning of weakening trend momentum | Confirmation of trend strength and continuation |
| Example | Price makes higher high, RSI makes lower high | Price makes higher high, RSI also makes higher high |
| Implication for Traders | Caution — trend may be losing strength | Confidence — trend likely to continue |
| Common Use Cases | Spotting potential reversals or slowdowns | Validating trend entries or trend-following strategies |
| Risk Level | Higher — can give false early signals | Lower — signals trend alignment |
| Analogy | Market forces are conflicting | Market forces are aligned |
Types of divergence
Most educational articles focus narrowly on the difference between convergence and divergence within a single indicator like the Relative Strength Index (RSI) or Moving Average Convergence Divergence (MACD). While these tools are useful, professional traders look at several forms of alignment or disagreement:
Macro divergence and convergence
Yield‑spread divergence. EFG Asset Management notes that the historical positive correlation between investment‑grade corporate bond spreads in developed markets and investment‑grade sovereign spreads in emerging markets broke down in 2023–2024; developed‑market spreads tightened while emerging‑market spreads stayed wide. This divergence was attributed to geopolitical risk and dollar strength. The firm argues that a convergence scenario in 2026 would require a stable macro backdrop, clarity on U.S. trade policy and attractive yield differentials.
Monetary‑policy divergence. AXA Investment Managers’ 2025 outlook highlights that monetary policy is likely to diverge across regions. Their economists expect the U.S. Federal Reserve to slow its rate‑cutting cycle because fiscal stimulus and trade tariffs may rekindle inflation. By contrast, they see the European Central Bank moving decisively into accommodative territory to offset weak growth, while China may allow the renminbi to depreciate to support exports. Such policy divergence creates opportunities for currency traders, particularly in carry trades.
Carry‑trade divergence. The ASEAN+3 Macroeconomic Research Office explains that for years, Japan’s ultra‑low interest rates made the yen the funding currency of choice for carry trades against the U.S. dollar, Mexican peso and Brazilian real. When the Fed signalled rate cuts and the Bank of Japan raised rates in mid‑2024, the yield differential narrowed and investors exited yen‑funded carry trades, causing a sharp appreciation of the yen. This illustrates how convergence or divergence in interest‑rate policies can trigger rapid reversals in currency markets.
Cross‑market and sentiment divergences
Intermarket divergence. Highly correlated instruments like EUR/USD and gold often move together, with a 52‑week correlation around +0.7. A negative divergence occurs when one market breaks away. For example, if the EUR/USD trending higher while gold begins to fall, this may be a foreshadowing of a subsequent decline in the currency pair. Convergence, by contrast, involves both assets moving in the same direction, reinforcing the signal.
Volume and tick divergences. In Forex, actual volume data do not exist because trading is over‑the‑counter. Traders therefore use tick volume as a proxy. A trend supported by rising tick volume signals strength, whereas a decline in tick volume while price continues higher forms a negative divergence and warns of fatigue.
Sentiment divergence. Divergences can also occur between price and positioning data. When price makes new highs but the Commitments of Traders (COT) report shows large speculators cutting long positions, there is a negative divergence suggesting underlying skepticism.
Behavioural divergence
False divergences and retracements. Divergence does not always herald a full trend reversal; they often precede a pullback or sideways move rather than an immediate change of trend. So, traders should treat divergence as a reason to tighten stops or take profits, not necessarily to reverse positions.
Overfitting in high‑frequency strategies. A study by Texas Tech University examined random‑forest models trained on minute‑level SPY data with many technical indicators. It found that while indicators like MACD and RSI improved certain risk metrics, they often led to poor out‑of‑sample performance. Sharpe ratios ranged between –0.0116 and 0.0046 and the models overfitted the training data. Feature‑importance analysis showed that simple price variables (open, close, high) were more informative than most technical indicators. This underscores that convergence or divergence signals must be used judiciously and supplemented with other analysis.
Types of divergence
Traders traditionally distinguish between “regular,” “hidden” and “exaggerated” divergences in price‑indicator relationships. More advanced analysis extends this classification to reflect the wider contexts described above:
Classic divergence. Price makes a higher high while an oscillator (e.g., RSI or MACD) makes a lower high (bearish) or price makes a lower low while the oscillator makes a higher low (bullish). Such patterns often signal trend weakness and a possible retracement.
Hidden divergence. Hidden divergence is often used to confirm trend continuation. In a bullish setup, the price forms a higher low while the oscillator dips to a lower low. In a bearish setup, the price shows a lower high as the oscillator records a higher high. Traders see these patterns as indications that the main trend is still valid, even if the market is temporarily pausing
Exaggerated divergence. Price forms a double top or bottom while the indicator forms lower highs or higher lows. These patterns indicate strong divergence and a higher probability of a reversal.
Cross‑market divergence. Divergences can arise between correlated instruments such as currency pairs and commodities.
Volume divergence. Occurs when price trends higher while tick volume declines or vice versa. Weakening volume suggests that the move lacks participation and may soon reverse.
Sentiment divergence. When price and positioning data (e.g., COT reports) move in opposite directions, it signals that professional traders’ sentiment is not confirming the price trend.
Macro divergence. Differences in economic policy, growth, or yield spreads across regions can signal major shifts. For example, the divergence between developed‑market corporate spreads and emerging‑market sovereign spreads in 2023–2024 highlighted geopolitical and currency risks.
Types of convergence
Just as there are multiple forms of divergence, different types of convergence matter to traders:
Indicator convergence. Price and oscillator are making higher highs or higher lows together (bullish) or lower highs/lows together (bearish). This alignment suggests that momentum is supporting the trend.
Cross‑asset convergence. Correlated assets such as bonds and equities move together, confirming macro themes. When emerging‑market sovereign spreads and developed‑market corporate spreads move in tandem, it implies agreement on risk perceptions and may signal a period of relative stability.
Policy convergence. Central banks moving towards similar policy stances (e.g., synchronized rate cuts) can reduce currency volatility. AXA IM notes that if the Federal Reserve eventually resumes cutting rates while the European Central Bank turns more accommodative, the trans‑Atlantic policy differential would narrow.
Volatility convergence. Realized volatility and implied volatility or interest‑rate volatility indicators (e.g., the MOVE index) moving together suggest that market expectations and actual risk are aligned. Divergence between these measures can precede spikes in market stress.
Sentiment convergence. Price action confirmed by rising bullish sentiment (e.g., increasing speculative long positions) signals strong momentum; alignment between sentiment indicators and price reduces the likelihood of false moves.
Examples of divergence and convergence
We have prepared examples of convergence and divergence so that you can clearly understand what the terms mean.
Convergence
The chart below shows the price movement of Brent crude oil. MACD is used as the indicator (its use is illustrative). In an uptrend, each new price high is higher than the previous one, which is confirmed by the highs on the MACD. This is an example of convergence, where the movement of price and the indicator align. Situations like this are typical for convergence and divergence in trading.

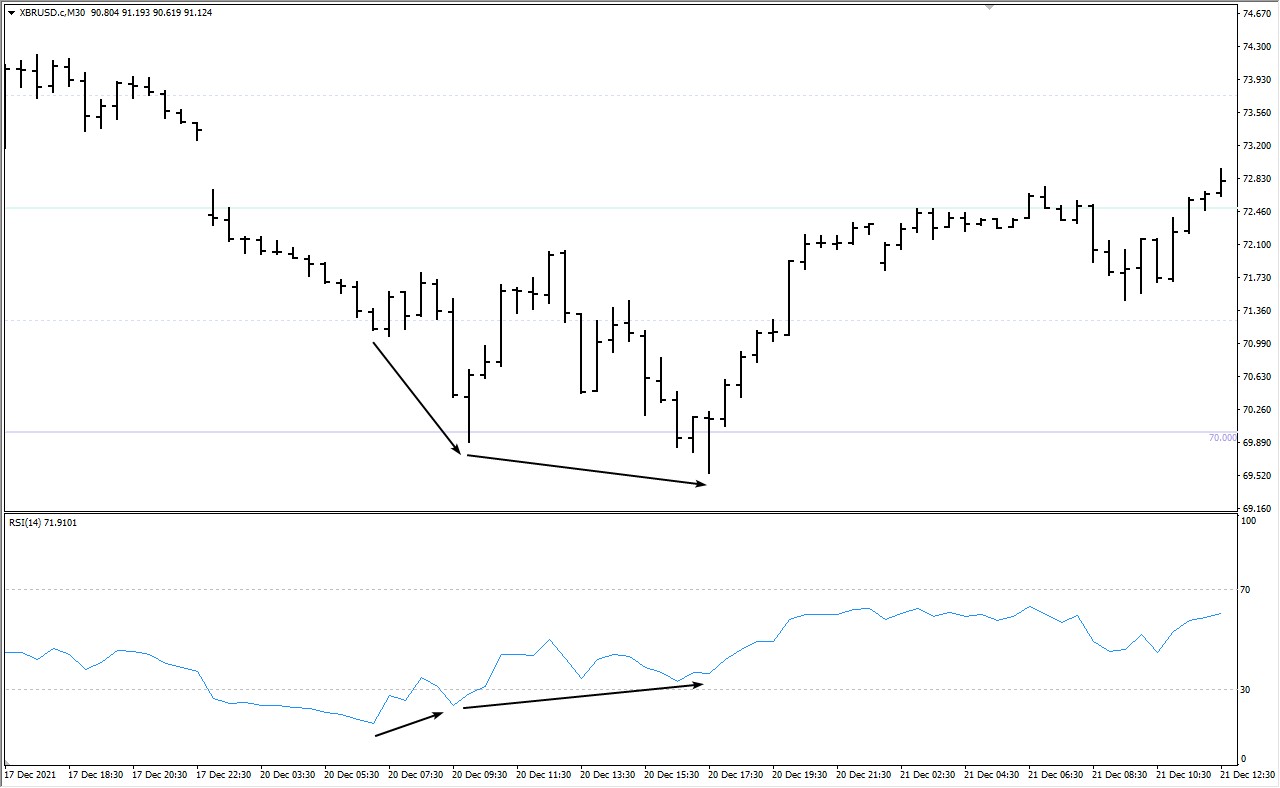
Divergence
Let’s look at an example using Brent crude oil and the RSI indicator. Here, the price lows are decreasing, while the lows on the indicator are increasing. This is a classic bullish divergence, signaling a weakening downtrend and a possible upward reversal. This case illustrates how signals can converge and diverge and helps clarify the difference between convergence and divergence in trading.
Where and how to find divergences and convergences? Popular indicators
Effective convergence and divergence in trading relies on using appropriate tools and understanding their limitations. Below are several sources and methods for identifying when signals converge and diverge:
MACD variants. The classic Moving Average Convergence Divergence measures the difference between short‑ and long‑term exponential moving averages. Volume‑weighted MACD (VW MACD) gives more weight to periods with high tick volume, making signals more reliable in liquid markets. Dual MACD compares a short‑term MACD with a longer‑term MACD to filter out noise. Research shows that these indicators have limited predictive power on their own, so combining them with sentiment data or other confirmations enhances results.
Relative Strength Index (RSI). RSI measures the speed and change of price moves. Positive or negative divergences between price and RSI often precede reversals. However, high‑frequency studies indicate that RSI’s impact on prediction accuracy is inconsistent. Use RSI divergences on longer time frames and confirm them with volume or sentiment data.
On‑Balance Volume and tick data. OBV accumulates volume based on whether price closes higher or lower. Divergence between price and OBV suggests that the move lacks participation. In Forex, tick volume serves as a proxy; declining ticks in an uptrend are a negative divergence.
Rate of Change (ROC). ROC measures the percentage change in price over a defined period. OANDA’s analysis shows that when price makes lower lows but ROC makes higher lows, a positive divergence occurs and often precedes a rally. Conversely, price making higher highs while ROC makes lower highs signals waning momentum.
Cross‑instrument correlations. Monitoring the relationship between related instruments (e.g., EUR/USD vs gold, stock indices vs bond yields) can reveal cross‑market divergences. A break in correlation may signal a forthcoming adjustment.
Sentiment and positioning data. Commitments of Traders reports, news sentiment scores and social‑media mood provide insight into whether market participants support the price action. Divergences between price and sentiment can be powerful early warnings. Hybrid strategies that integrate sentiment with technical indicators outperform those using technical indicators alone.
Macro data and policy indicators. Watch for divergences between economic growth trajectories, fiscal policies and central‑bank actions.
The key is to interpret these signals within the broader context. Divergence analysis should always consider price action, market conditions and expected fundamental events; used alone it increases the risk of false signals.
To turn convergence/divergence theory into trades, you’ll want a broker that gives you the right tools and data, like fast charts, reliable tick volume, and native access to indicators like RSI, MACD, AO, plus custom scripts and backtesting. Platforms such as TradingView, MT5, MT4, and cTrader make it easier to spot and confirm signals across timeframes, while solid regulation and fair fees keep the focus on execution, not costs. Below we’ve shortlisted the best brokers with strong technical toolkits so you can scan, test, and trade divergence/convergence setups with confidence.
| Currency pairs | Crypto | Stocks | Min. deposit, $ | Max. leverage | TradingView | MT5 | cTrader | Regulation | TU overall score | Open an account | |
|---|---|---|---|---|---|---|---|---|---|---|---|
| 120 | Yes | Yes | 1 | 1:30 | Yes | Yes | Yes | CNMV | 5.45 | Study review | |
| 90 | Yes | Yes | No | 1:500 | Yes | Yes | Yes | ASIC, FCA, DFSA, BaFin, CMA, SCB, CySec | 9.25 | Go to broker Your capital is at risk.
|
|
| 90 | Yes | Yes | 1 | 1:500 | Yes | Yes | Yes | ASIC, VFSC, FSA | 9.2 | Go to broker Your capital is at risk. |
|
| 70 | Yes | Yes | 100 | 1:500 | No | Yes | Yes | FCA, CYSEC, FSCA, SCB, FSA (Seychelles) | 8.7 | Go to broker Your capital is at risk. |
|
| 61 | Yes | Yes | 200 | 1:5000 | Yes | Yes | Yes | FSA (Seychelles) | 8.06 | Go to broker Your capital is at risk. |
Risks and warnings regarding trading based on convergence and divergence
False signals. Oscillators such as the stochastic indicator can generate frequent divergences that do not lead to meaningful price changes. Overreliance on a single indicator may lead to losses. High‑frequency research has shown that technical indicators alone often deliver poor out‑of‑sample performance.
Retrospective identification. Divergences often become obvious only after they have formed. By the time a divergence is clear, price may have already retraced.
Market noise. Short‑term time frames contain considerable noise and micro‑structure effects, which can distort technical indicators and create false divergences. Use longer time frames and confirm with volume and sentiment.
Macro catalysts. Changes in interest rates, trade policies or geopolitical events can overwhelm technical divergences. As AXA IM notes, a divergence in monetary policy or fiscal stance can drive currencies and bonds regardless of what indicators show. Always monitor macro risk.
Overfitting. Machine‑learning models that rely on a large number of technical indicators may fit historical patterns but fail to generalise. This can produce misleading convergence or divergence signals in live markets.
Risk of misjudging trend strength. Divergence signals may encourage traders to fade a trend too early. Divergence implies a change but not necessarily a reversal. Combining divergences with confirmation tools and proper risk management is essential.
Control your risk using stop-losses and additional analysis tools.
Spotting real signals with timeframe and volume analysis

When traders talk about divergence and convergence, most stop at “price and indicator moving apart”, but the real edge comes from timeframe layering. For example, if you spot bullish divergence on a 15-minute chart but the daily chart shows convergence confirming the broader trend, the short-term signal is weaker. Beginners who learn to always cross-check divergences across multiple timeframes avoid the classic trap of chasing every RSI or MACD mismatch. This layered view not only filters out noise but also reveals moments when a small divergence aligns with a long-term shift, which often marks explosive turning points.
Another overlooked detail is volume behavior during divergence. Many assume divergence alone signals reversal, but if volume contracts while price diverges from the indicator, it usually reflects exhaustion rather than strength. On the other hand, when divergence forms with increasing volume, it often suggests a deeper structural imbalance in the market that can fuel major trend changes. Watching how liquidity flows while divergence builds is like seeing under the hood of the market, and it’s what separates casual chart watchers from traders who consistently spot high-probability setups.
Conclusion
Convergence is the alignment of price movement and indicator behavior. Divergence is a discrepancy that signals a possible trend reversal. Use divergences to identify favorable entry points, but always confirm them with other analytical methods and manage risks. Build a system based on divergences and evaluate its performance to achieve your financial goals. These principles form the core of applying convergence and divergence in trading.
FAQs
On which markets can divergences be used?
Divergences can be applied in all markets: Forex, stocks, commodities, and cryptocurrencies. They are universal and effective for any financial instrument. Understanding convergence vs divergence helps determine how to apply them appropriately across different asset classes.
How to choose a timeframe for divergence analysis?
It is better to start with higher timeframes, such as daily or weekly charts, to reduce the impact of market noise. On shorter timeframes, signals may be less reliable. In such cases, traders should pay attention to whether indicators converge or diverge to assess the signal's strength.
Does divergence always indicate a trend reversal?
No, not always. Some divergences may turn out to be false signals, especially without confirmation from other analysis methods. Recognizing the difference between convergence and divergence is crucial for interpreting such cases correctly.
Why is it important to confirm divergences with additional tools?
Divergences alone do not guarantee success. Additional tools help avoid false signals and improve forecasting accuracy. In the broader context of convergence and divergence, confirmation is a key element of reliable strategy execution.
Editors' Top Picks and Insights

Crypto test drive: How automakers are exploring digital assets

Lindsey Graham death: U.S. senator’s crypto legacy

Tether under pressure: USDT in Europe, audit questions, and the fight for trust

Lean Ethereum: Why Buterin wants to rebuild the network

SK Hynix debuts on Nasdaq: Largest U.S. offering by foreign company

SpaceX falls out of orbit: Does anyone still want Musk’s stock?
Related Articles
Team that worked on the article
Anton Kharitonov is an active trader and analyst. He employs both short- and long-term trading strategies, primarily based on fundamental factors, supported by technical indicators and intermarket analysis.
Dan Blystone began his trading career in 1998 as an arbitrage clerk on the floor of the Chicago Mercantile Exchange (CME). He later traded bond and Eurex futures at proprietary firms such as Altea Trading, gaining valuable experience in high-frequency trading and risk management.
Chinmay Soni is a financial analyst with more than 5 years of experience in working with stocks, Forex, derivatives, and other assets. As a founder of a boutique research firm and an active researcher, he covers various industries and fields, providing insights backed by statistical data.
CFD is a contract between an investor/trader and seller that demonstrates that the trader will need to pay the price difference between the current value of the asset and its value at the time of contract to the seller.
Day trading involves buying and selling financial assets within the same trading day, with the goal of profiting from short-term price fluctuations, and positions are typically not held overnight.
Bitcoin is a decentralized digital cryptocurrency that was created in 2009 by an anonymous individual or group using the pseudonym Satoshi Nakamoto. It operates on a technology called blockchain, which is a distributed ledger that records all transactions across a network of computers.
Backtesting is the process of testing a trading strategy on historical data. It allows you to evaluate the strategy's performance in the past and identify its potential risks and benefits.
Forex trading, short for foreign exchange trading, is the practice of buying and selling currencies in the global foreign exchange market with the aim of profiting from fluctuations in exchange rates. Traders speculate on whether one currency will rise or fall in value relative to another currency and make trading decisions accordingly. However, beware that trading carries risks, and you can lose your whole capital.

-
 Afghanistan
-
 Albania
-
 Algeria
-
 Angola
-
 Argentina
-
 Armenia
-
 Australia
-
 Austria
-
 Azerbaijan
-
 Bahamas
-
 Bahrain
-
 Bangladesh
-
 Belarus
-
 Belgium
-
 Bolivia
-
 Botswana
-
 Brazil
-
 Brunei
-
 Bulgaria
-
 Cambodia
-
 Cameroon
-
 Canada
-
 Chile
Chile
-
 China
China
-
 Colombia
-
 Congo
Congo
-
 Costa Rica
-
 Cote d'Ivoire
-
 Croatia
-
 Cuba
Cuba
-
 Cyprus
-
 Czechia
-
 DR Congo
-
 Denmark
-
 Dominican Republic
-
 Ecuador
-
 Egypt
Egypt
-
 El Salvador
-
 Estonia
-
 Eswatini
-
 Ethiopia
-
 Finland
-
 France
-
 Georgia
-
 Germany
-
 Ghana
Ghana
-
 Greece
-
 Haiti
Haiti
-
 Hong Kong
-
 Hungary
-
 India
India
-
 Indonesia
-
 Iran, Islamic republic
-
 Iraq
Iraq
-
 Ireland
-
 Israel
-
 Italy
Italy
-
 Jamaica
-
 Japan
Japan
-
 Jordan
-
 Kazakhstan
-
 Kenya
Kenya
-
 Korea
Korea
-
 Kuwait
-
 Kyrgyzstan
-
 Laos
Laos
-
 Latvia
-
 Lebanon
-
 Lesotho
-
 Libya
Libya
-
 Lithuania
-
 Luxembourg
-
 Madagascar
-
 Malaysia
-
 Malta
Malta
-
 Mauritius
-
 Mexico
-
 Moldova
-
 Mongolia
-
 Montenegro
-
 Morocco
-
 Mozambique
-
 Myanmar
-
 Namibia
-
 Nepal
Nepal
-
 Netherlands
-
 New Zealand
-
 Nigeria
-
 North Macedonia
-
 Norway
-
 Oman
Oman
-
 Pakistan
-
 Palestine
-
 Panama
-
 Papua New Guinea
-
 Paraguay
-
 Peru
Peru
-
 Philippines
-
 Poland
-
 Portugal
-
 Puerto Rico
-
 Qatar
Qatar
-
 Reunion
-
 Romania
-
 Rwanda
-
 Saudi Arabia
-
 Serbia
-
 Singapore
-
 Slovakia
-
 Slovenia
-
 Somalia
-
 South Africa
-
 Spain
Spain
-
 Sri Lanka
-
 Sweden
-
 Switzerland
-
 Syria
Syria
-
 Taiwan
-
 Tajikistan
-
 Tanzania
-
 Thailand
-
 Trinidad and Tobago
-
 Tunisia
-
 Turkey
-
 UAE
UAE
-
 Uganda
-
 Ukraine
-
 United Kingdom
-
United States
-
 Uruguay
-
 Uzbekistan
-
 Venezuela
-
 Vietnam
-
 Yemen
Yemen
-
 Zambia
-
 Zimbabwe
- Forex
- Crypto
