Top Chart Patterns To Spot The Market Reversal


Editorial Note: While we adhere to strict Editorial Integrity, this post may contain references to products from our partners. Here's an explanation for How We Make Money. None of the data and information on this webpage constitutes investment advice according to our Disclaimer.
Best reversal patterns:
Head and Shoulders. A classic reversal pattern indicating a shift from an uptrend to a downtrend, marked by three peaks with the middle one highest.
Wedge Pattern. A narrowing price formation signaling a potential breakout in the opposite direction of the prevailing trend.
Double Top Pattern. A bearish reversal sign where price hits a resistance level twice before declining.
Rounding Bottom Pattern. A bullish pattern showing a gradual reversal from a downtrend, forming a bowl-like shape.
Cup and Handle Pattern. A continuation or reversal setup where price forms a "cup" shape followed by a small consolidation resembling a "handle" before breaking upward.
Learning how to spot trend reversal patterns is a valuable skill that can help traders catch early signals and improve their overall returns. This guide from Traders Union breaks down 12 essential reversal setups, beginning with their meaning and why they matter. It takes a closer look at both chart patterns and candlestick signals, offering practical ways to use them when navigating changing markets.
Best reversal chart patterns
A trend reversal pattern signals a shift in the price direction of a financial asset such as a stock. This shift could mean that an uptrend is losing momentum and turning into a downtrend, or the reverse. Bullish reversals are seen when a rising trend gives way to falling highs and lows, which suggests prices might head lower. Bearish reversals appear when a downtrend starts forming higher highs and higher lows, hinting at upward movement ahead.
The Piercing Line pattern is an easily recognizable two-candle formation that can help you spot potential market changes. It consists of a long red candle followed by a long green candle. The green candle opens below the red candle's lowest point but ends up closing more than halfway above the middle of the red candle. This strong finish of the green candle indicates that the market is shifting, and buyers are gaining strength.
Head and Shoulders pattern
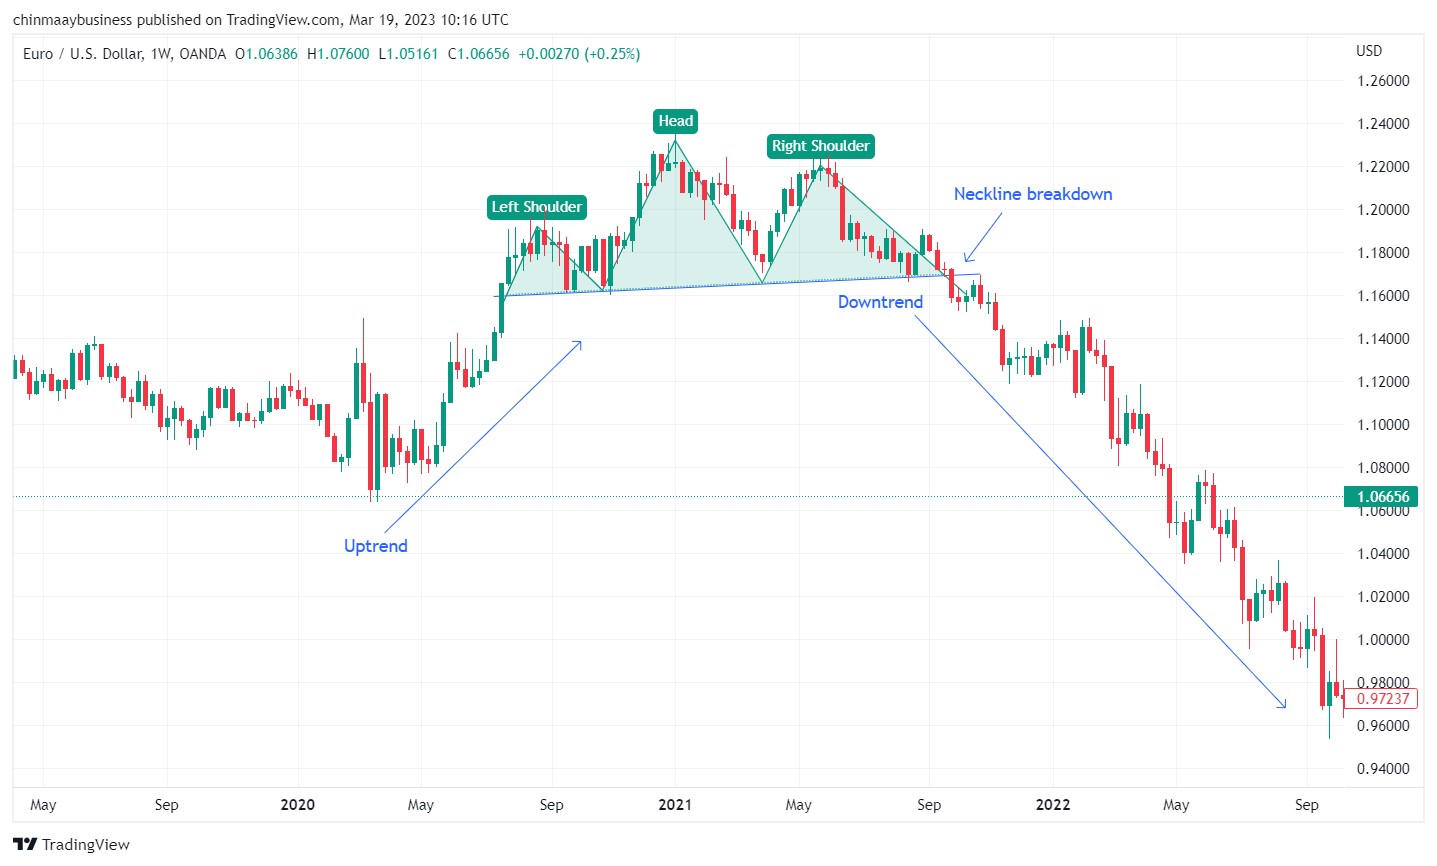
The Head and Shoulders pattern is a highly-regarded trading technique for detecting trend reversals by analyzing specific chart formations. This method relies on spotting a price pattern consisting of a central peak (the head) flanked by two lower peaks (the shoulders). Evaluating the market's behavior around these critical formations allows traders to make well-informed decisions about entry, exit, and risk management.
Entry point. The entry point for the Head and Shoulders pattern is identified when the pattern is completed, as indicated by a break below the neckline (a support level connecting the lows between the head and shoulders). Traders should monitor the price action and volume during the break for additional confirmation.
Exit point. To establish exit points using this pattern, measure the pattern's height and use Fibonacci retracement levels for potential take-profit zones. Setting a stop-loss order above the right shoulder can help minimize potential losses in case the pattern fails.
Wedge pattern
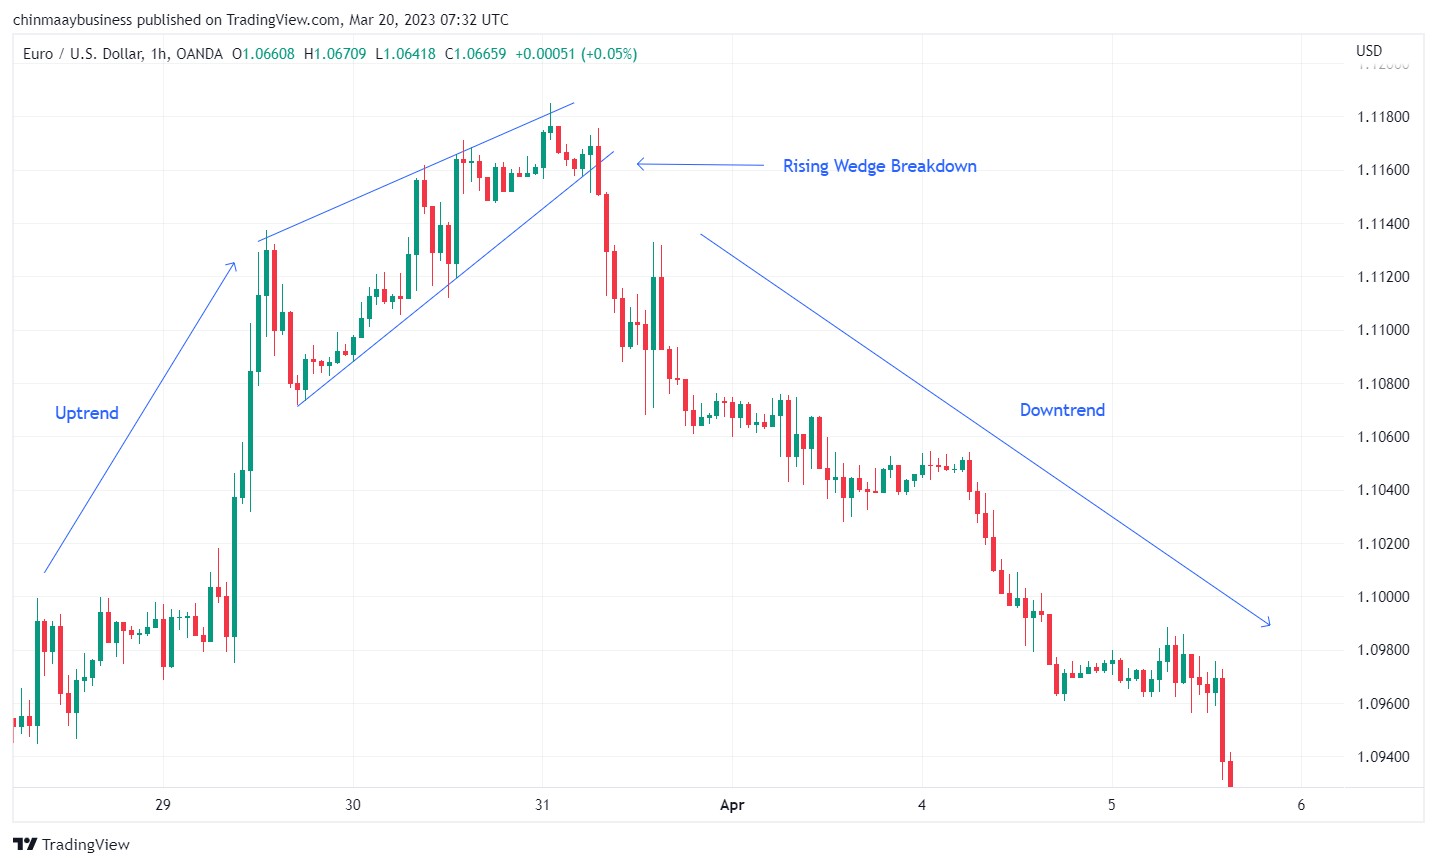
A wedge pattern can be a signal for either bullish or bearish price reversals, characterized by three common features: converging trend lines, declining volume as the pattern progresses, and a breakout from one of the trend lines. The two forms of the wedge pattern are the rising wedge (indicating a bearish reversal) and the falling wedge (signaling a bullish reversal).
Entry point. As a rising wedge pattern suggests the potential for falling prices after a breakout of the lower trend line, traders should consider entering a short position or using derivatives after the breakout occurs. For a falling wedge pattern, traders should look for bullish reversal signals and consider entering a long position or using derivatives that benefit from the security's increase in price after the breakout above the upper trend line.
Exit point. For both rising and falling wedge patterns, traders can use Fibonacci retracement levels to determine suitable take-profit levels. Additionally, setting a stop-loss order above the second peak (for rising wedge) or below the lowest point (for falling wedge) can help minimize potential losses.
Double Top pattern
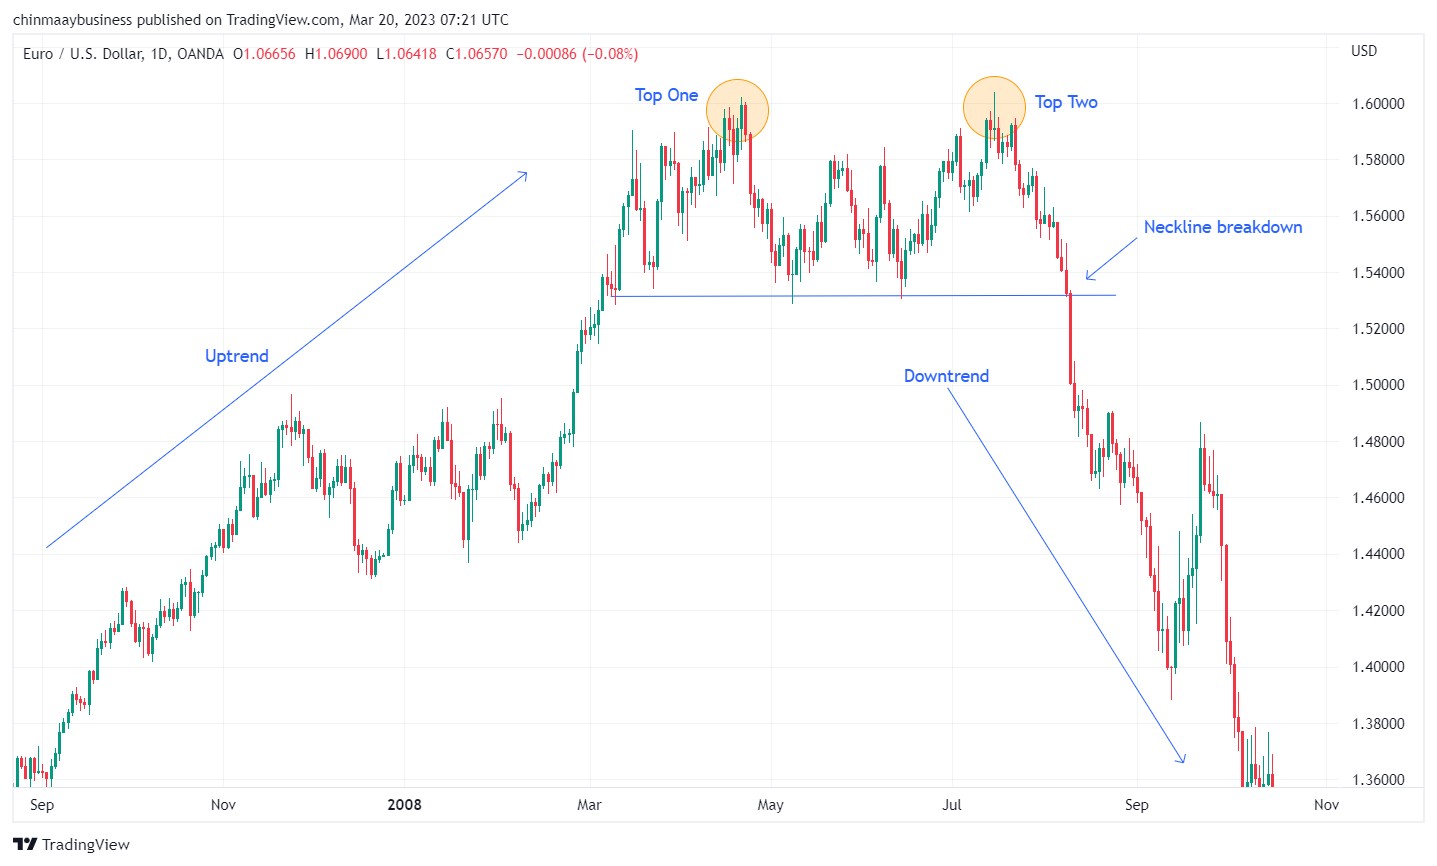
The Double Top pattern is a well-known reversal pattern visible on different kinds of charts. This pattern often signals a likely shift in the asset's direction, reversing its course and moving in the opposite direction. The Double Top is characterized by two separate peaks at approximately the same price level, with a trough between them, often called the neckline.
Entry point. You might choose to go short when the price breaks below the neckline after the formation of the second peak and as the price starts to retreat towards the neckline. Monitor the volume during the break to strengthen your trade setup.
Exit point. You can also choose to fix an exit point at a distance similar to that between the neckline and double-top-high. You can also choose to fix a predetermined exit depending on how much risk you're willing to take for the potential return.
Rounding Bottom pattern
The Rounding Bottom pattern is a well-regarded reversal pattern that can be identified across various chart types. This pattern often indicates that an asset's current direction is about to shift, reversing its course and moving in the opposite direction. The Rounding Bottom is characterized by a gradual, curved decline in price followed by a steady, curved ascent, resembling a bowl or saucer shape.
Entry point. In a Rounding Bottom pattern, consider entering a long position when the price breaks above the level immediately prior to the start of the initial decline, signaling a breakout from the pattern's low point. As the stock recovers and completes the pattern, monitor the volume for confirmation, as it ideally increases alongside the rising price.
Exit point. To establish an exit point, identify the price level at the start of the initial decline and use it as a target for taking profit. Additionally, set a stop-loss order below the lowest point of the rounding bottom to minimize potential losses.

Cup and Handle pattern
The Cup and Handle pattern is a widely known bullish formation that traders spot across different chart formats. This setup often suggests that the existing uptrend of an asset may continue after a temporary pause in momentum. The Cup and Handle looks like a “U”-shaped curve followed by a smaller dip to the side, giving the appearance of a teacup with a handle.
Entry point. In a Cup and Handle pattern, you might look to buy when the price moves above the upper edge of the handle’s trend line. A common strategy is to place a stop order just above this level or wait until the price closes over it and then place a limit order slightly below the breakout point.
Exit point. To figure out when to exit, take the vertical distance from the lowest point of the cup to the breakout line, and project that same distance upward from the breakout. For instance, if that gap is 20 points, then your target could be 20 points above the breakout. Stop-loss orders can be set under the handle or even below the cup, based on how much risk you are prepared to take and how the market is behaving.

Triple Bottom pattern
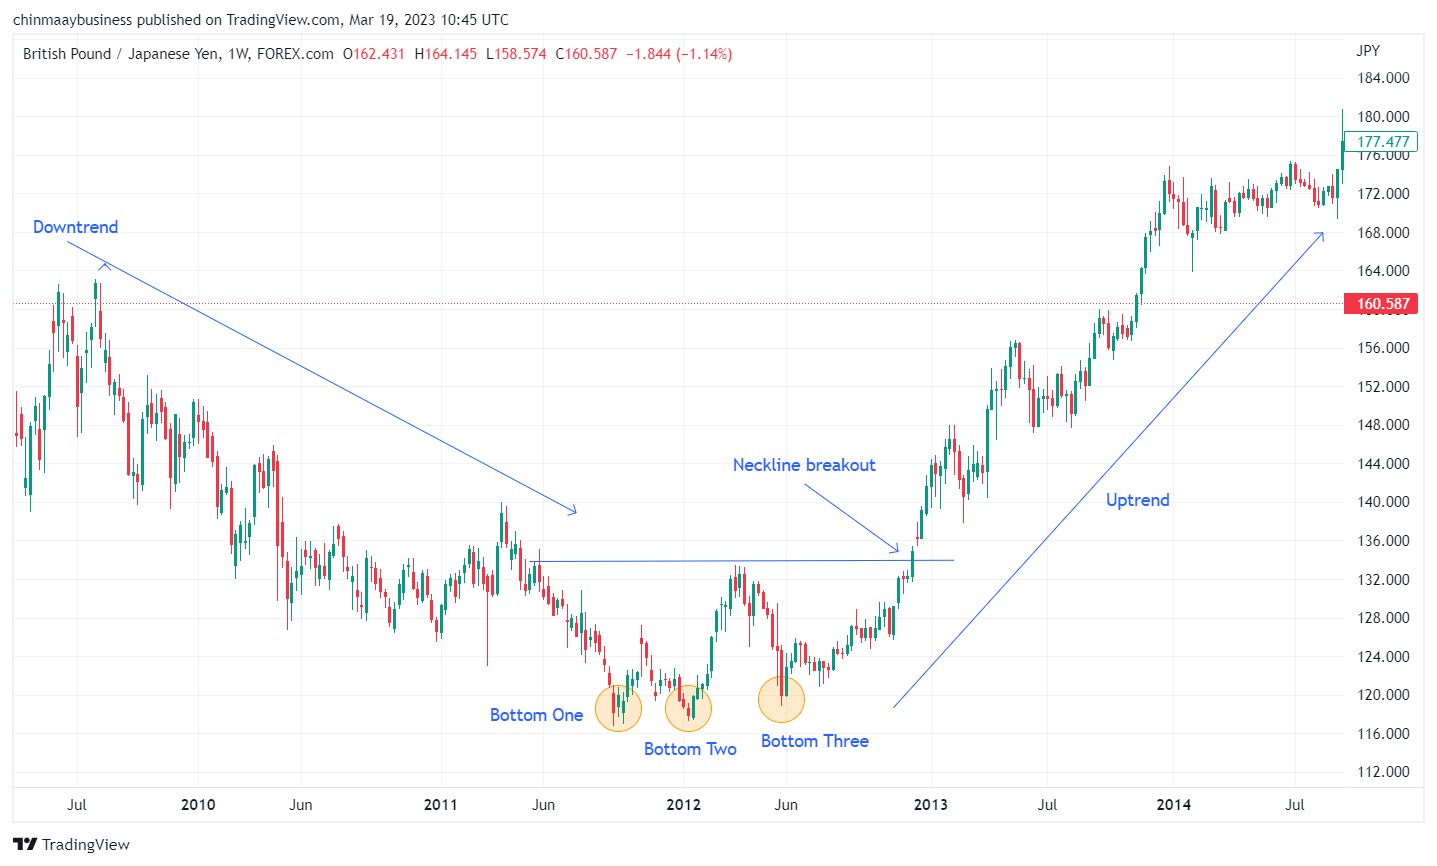
The Triple Bottom pattern is a rare and highly effective reversal pattern. This pattern typically indicates that the asset's current downtrend is nearing its end, and a reversal is imminent. The Triple Bottom is characterized by three consecutive lows at or near the same level, with a clear downtrend leading up to the formation. A horizontal support line connects the lows, while a neckline connects the highs of the rebounds.
Entry point. In a Triple Bottom pattern, consider entering a long position when the price breaks above the neckline following the third unsuccessful attempt by sellers to push the price lower. This break signals the activation of the pattern and suggests that buyers have gained control.
Exit point. To set an exit point, measure the distance between the neckline and the horizontal support line, and use this distance to project a target price above the neckline. Additionally, place a stop-loss order below the horizontal support line to minimize potential losses.
Best reversal candlestick patterns
Hammer
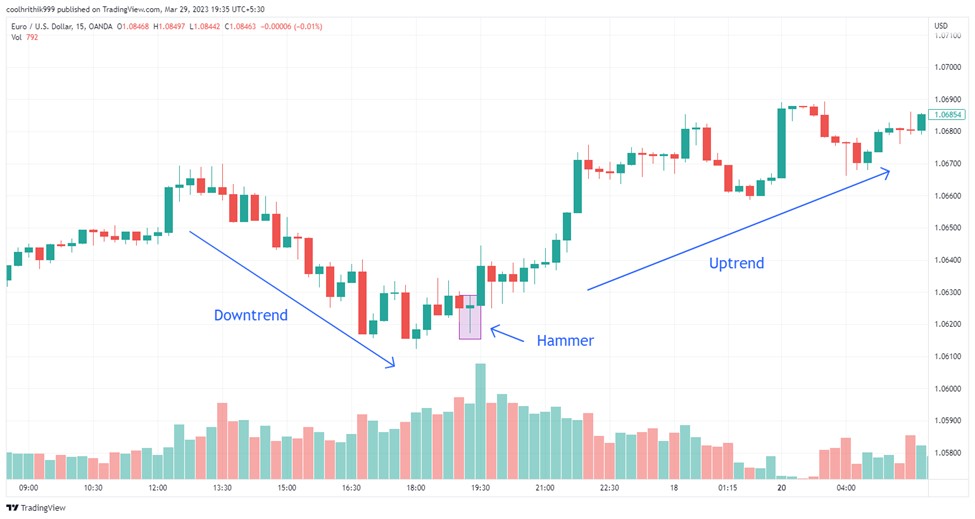
The Hammer candlestick pattern emerges when the low of a financial instrument significantly exceeds its opening price but eventually rebounds to close near the opening price. The extended lower shadow of this pattern tells us that sellers initially managed to drive the price down; however, buyers reclaimed control and pushed the price back up, hinting at a potential bullish reversal.
Entry point. Consider entering a long position when a Hammer pattern appears at the end of a downtrend or near significant support levels. Additionally, confirm the bullish reversal with the presence of a subsequent green candle or other supporting technical indicators.
Exit point. Use a combination of moving averages and support levels to determine an appropriate exit point. As the price rises and approaches a moving average or key support-turned-resistance level, consider exiting the trade to lock in profits before a potential reversal.
Engulfing Candle pattern
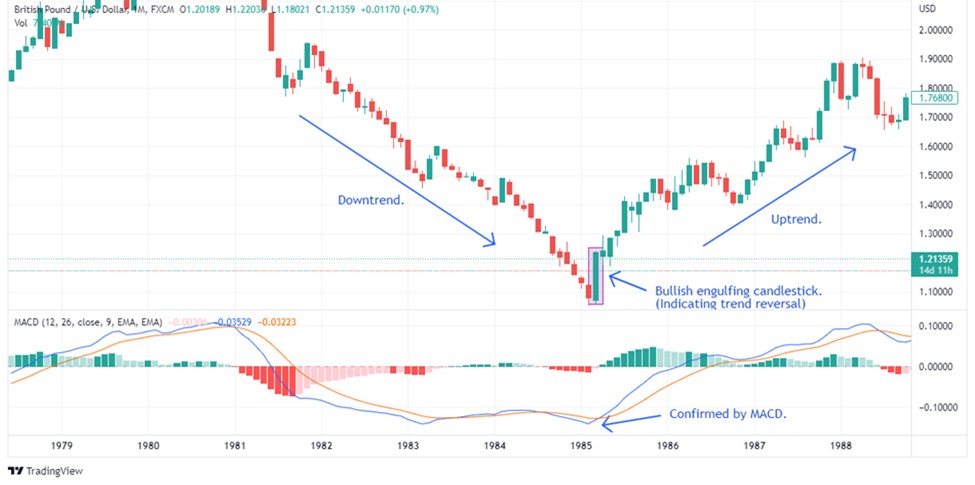
The Engulfing Candle pattern is a powerful two-candle pattern that often appears when a prevailing trend, either upward or downward, begins to lose momentum. This pattern is marked by a smaller candlestick followed by a larger one that completely engulfs the preceding candle. Spotting this pattern can signal an opportune moment to enter a trade in the direction opposite the previous trend.
Entry point. In a bullish engulfing pattern, initiate a long position once the second candlestick is completed and accompanied by increased volume, adding validity to the trade setup.
Exit point. When engaging in a long trade, it is advisable to exit the position when the price reaches significant resistance levels, demonstrates signs of reversing, or when a bearish reversal pattern emerges.
Doji
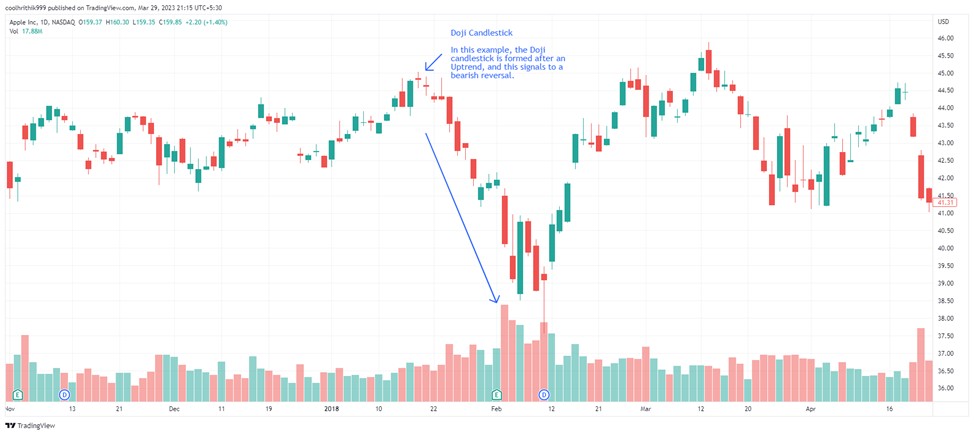
A Doji candlestick forms when an asset opens and closes at almost the same price, creating a candle with a very thin or invisible body and often extended wicks. This pattern reflects market uncertainty, indicating that bulls and bears are evenly matched. Depending on its placement within a chart and the direction of the previous trend, a Doji can suggest either a pause before continuation or an upcoming reversal.
Entry point. A Doji pattern alone is not a strong signal for entry. However, when it appears in conjunction with other technical indicators or patterns, it can provide valuable insight. Look for confirmation from subsequent candles or other technical indicators to identify potential trend reversals or continuations.
Exit point. When trading with a Doji pattern, use trendlines to determine potential exit points. Draw trendlines connecting recent highs and lows to identify a price channel. Exit the trade when the price approaches or breaks the opposite trendline, signaling a potential change in trend direction.
Evening Star
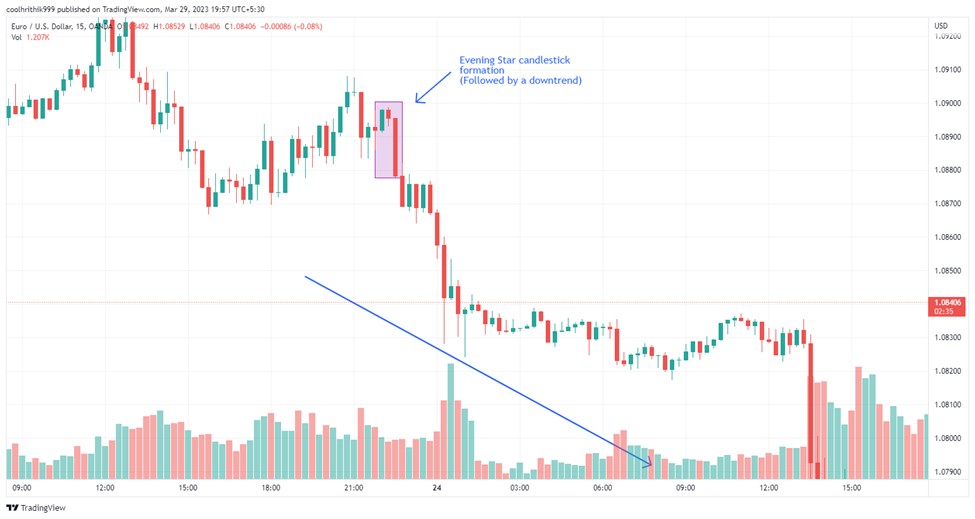
The Evening Star is a three-candle formation signaling a potential bearish reversal. It begins with a strong bullish (green) candle, followed by a small-bodied candle that gaps upward, reflecting market hesitation. The pattern concludes with a decisive bearish (red) candle that closes deep into the body of the first, confirming the shift in momentum from buyers to sellers.
Entry point. After the small-bodied candle appears, signaling market uncertainty, watch for the emergence of the long red candle. Once the red candle closes within the range of the first green candle, consider initiating a short position, as this indicates a potential bearish reversal.
Exit point. With the Evening Star pattern, implement a profit target based on a percentage retracement of the previous uptrend. Utilize the Fibonacci retracement tool to identify potential support levels (such as 38.2%, 50%, or 61.8%) and consider exiting the trade when the price reaches one of these levels.
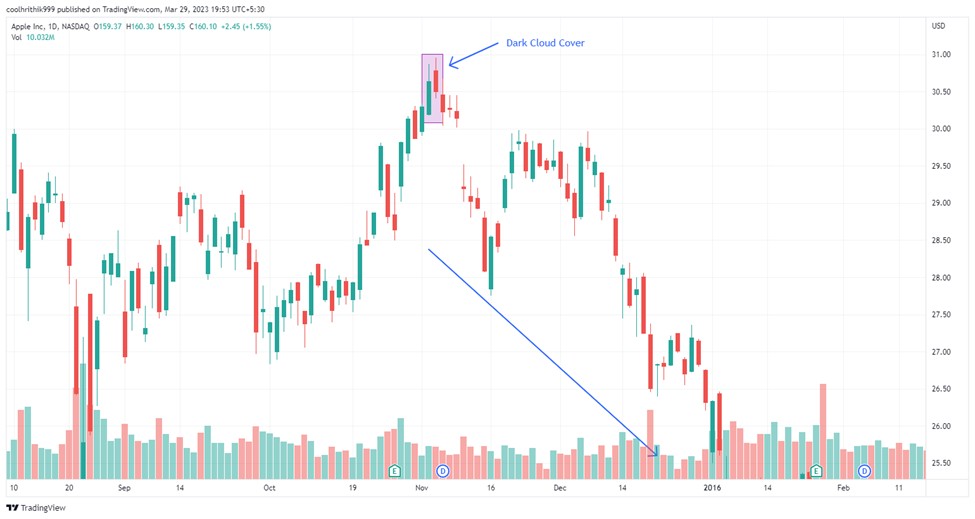
Dark Cloud Cover
The Dark Cloud Cover is a bearish two-candle pattern where a strong green candle is followed by a red candle that opens above the previous high but closes deep into the first candle’s body — typically past its midpoint. This formation signals a sharp shift in sentiment, highlighting growing selling pressure and a potential trend reversal in favor of the bears.
Entry point. When a Dark Cloud Cover pattern appears at the end of an uptrend or near significant resistance levels, consider entering a short position. Confirm the bearish reversal with the presence of a subsequent red candle or other supporting technical indicators.
Exit point. For the Dark Cloud Cover pattern, consider employing a trailing stop-loss to capitalize on potential downward momentum while protecting your trade from sudden reversals. Adjust the stop-loss as the price continues to decline and exit the position when the stop-loss is triggered.
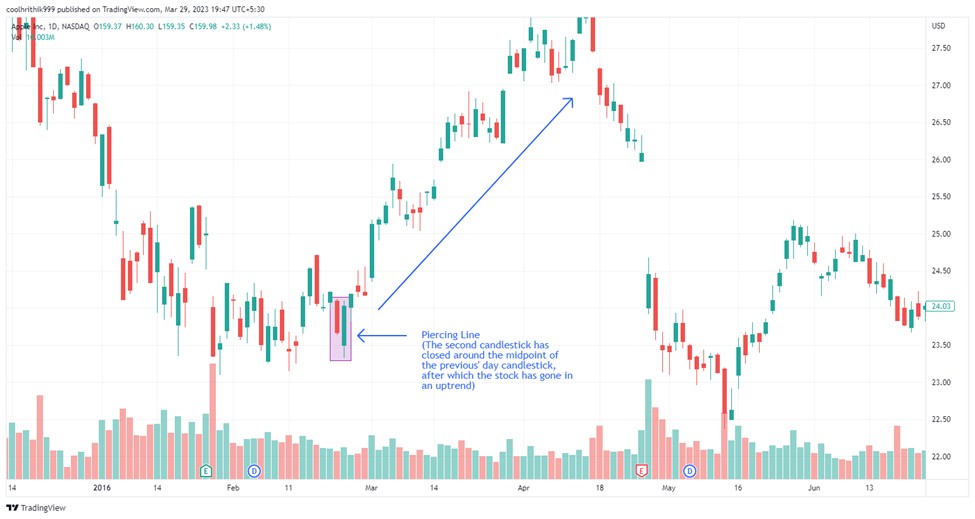
Piercing Line pattern
The Piercing Line pattern is an easily recognizable two-candle formation that can help you spot potential market changes. It consists of a long red candle followed by a long green candle. The green candle opens below the red candle's lowest point but ends up closing more than halfway above the middle of the red candle. This strong finish of the green candle indicates that the market is shifting, and buyers are gaining strength.
This pattern is mostly seen in stocks, as they can experience price gaps overnight. However, it may also be found in other types of assets when examining weekly charts.
Entry point. When the long green candle closes above the middle of the red candle, it's a sign that buyers are starting to take control. This is a good time to consider buying, as it suggests the market is becoming more bullish. To further validate the trade setup, monitor the volume during the emergence of the green candle.
Exit point. To decide when to exit the market and set a target price, look for important resistance levels or spots where the price reversed in the past. To calculate a target price, measure the distance from the lowest point of the green candle to the highest point of the red candle. Add this distance to the highest point of the green candle, and you'll have a target price.
Strategies for pattern confirmation
Confirming a pattern in technical analysis is more than just spotting shapes on a chart. Timing, volume, and traps play a huge role.
Watch the volume spike. A real breakout that’s not a fakeout usually comes with a sudden 30 to 50 percent jump in volume within the first 15 minutes of the candle close.
Wait for the retest wick. On higher timeframes like 1H or 4H, a wick touching the breakout level again after 2 to 3 candles often shows traders are serious.
Track RSI divergence lag. If RSI divergence appears 3 to 5 candles before the breakout and price stays flat, it’s often a clue before the move.
Use the liquidity sweep check. Big players often trigger a fake move first, so if price takes out recent highs or lows and quickly snaps back within 30 minutes, that’s your sign.
Apply anchored VWAP support. Set anchored VWAP from the last swing low or high. If price touches and bounces off it within 1 or 2 candles after the breakout, it’s solid confirmation.
Notice option data shifts. Look for sudden spikes in interest at strike prices near breakout zones. These hint at what big traders might do next, sometimes hours in advance.
Advanced contextual analysis for reversals
Spotting reversal patterns is helpful, but understanding the bigger picture makes the signals more reliable. Here are some deeper ways to assess them:
Market sentiment indicators
Sentiment tools like the Fear and Greed Index or Commitment of Traders (COT) reports offer a view into how investors are feeling. These emotional cues can support or challenge what a pattern shows. For instance, a bullish engulfing candle during peak fear levels may point to a strong buy opportunity.
Intermarket analysis
Looking at how related markets move together helps confirm signals. For example, if gold starts reversing, that could tie in with changes in bond yields or the US dollar index. A Head and Shoulders pattern forming in equities while the dollar weakens adds strength to the reversal case.
Volume profile analysis
Analyzing volume helps reveal where strong buying or selling activity is concentrated. A pattern like a rounding bottom forming at a high-volume area can show buyers stepping in, which raises the odds of a trend reversal in the bullish direction.
Use failed patterns and volume traps to catch high-confidence reversals early

New traders often chase the cleanest chart patterns, but the market doesn’t care about symmetry. What really matters is when a pattern starts forming but then suddenly breaks the other way. That quick flip? It traps traders who got in too early. That trap sets off a chain reaction, often leading to powerful reversals. Watch how price reacts right after a pattern fails, not before. That’s where the real story begins.
Also, don’t just look at shapes, listen to the volume. If the price pulls back during a reversal setup but the volume drops off a cliff, that move is probably running out of steam. Add something like RSI or MACD divergence to confirm your suspicion, and you’re not guessing anymore, you’re stacking odds in your favor. Forget the perfect setups you see in trading books. Real reversals are noisy, messy, and full of clues most people ignore.
Conclusion
Identifying trend reversal patterns is essential for spotting opportunities and improving trading results. This guide covers the top 12 reversal patterns, explaining their definitions, chart formations, and candlestick indicators. These tools help predict market changes and enhance strategic decisions in trading. Mastering these patterns provides traders with a framework to analyze trends, minimize risks, and optimize their market positions.
FAQs
Can reversal patterns work on intraday charts like 5-minute or 15-minute timeframes?
Yes, they can. Reversal patterns appear on all timeframes, but the smaller the timeframe, the more noise and false signals you'll encounter. Use additional confirmation tools like volume, RSI divergence, or VWAP to filter out weak setups on intraday charts.
Do reversal patterns apply to crypto markets too, or just stocks and Forex?
Absolutely. These patterns are based on price action and psychology, not the asset itself. Whether you're trading Bitcoin or biotech stocks, reversal setups like Double Tops or Hammers can still provide solid entry and exit signals.
How do I know if a pattern is forming or has already failed?
Watch for volume drop-offs and weak follow-through. If a breakout from a pattern lacks momentum or quickly snaps back into the range, it’s likely a failed setup. This is often a trap, and sometimes a better signal in the opposite direction.
Can I combine reversal patterns with news events?
Definitely. News often acts as the catalyst for pattern completion or failure. A reversal pattern forming around earnings reports, central bank announcements, or major geopolitical events can become more reliable when price action aligns with the news tone.
Related Articles
Team that worked on the article
Andrey Mastykin is an experienced author, editor, and content strategist who has been with Traders Union since 2020. As an editor, he is meticulous about fact-checking and ensuring the accuracy of all information published on the Traders Union platform. Andrey focuses on educating readers about the potential rewards and risks involved in trading financial markets.
He firmly believes that passive investing is a more suitable strategy for most individuals. Andrey's conservative approach and focus on risk management resonate with many readers, making him a trusted source of financial information.
Also, Andrey is a member of the National Union of Journalists of Ukraine (membership card No. 4574, international certificate UKR4492).
Chinmay Soni is a financial analyst with more than 5 years of experience in working with stocks, Forex, derivatives, and other assets. As a founder of a boutique research firm and an active researcher, he covers various industries and fields, providing insights backed by statistical data. He is also an educator in the field of finance and technology.
As an author for Traders Union, he contributes his deep analytical insights on various topics, taking into account various aspects.
Mirjan Hipolito is a journalist and news editor at Traders Union. She is an expert crypto writer with five years of experience in the financial markets. Her specialties are daily market news, price predictions, and Initial Coin Offerings (ICO).
Forex trading, short for foreign exchange trading, is the practice of buying and selling currencies in the global foreign exchange market with the aim of profiting from fluctuations in exchange rates. Traders speculate on whether one currency will rise or fall in value relative to another currency and make trading decisions accordingly. However, beware that trading carries risks, and you can lose your whole capital.
Index in trading is the measure of the performance of a group of stocks, which can include the assets and securities in it.
Yield refers to the earnings or income derived from an investment. It mirrors the returns generated by owning assets such as stocks, bonds, or other financial instruments.
An investor is an individual, who invests money in an asset with the expectation that its value would appreciate in the future. The asset can be anything, including a bond, debenture, mutual fund, equity, gold, silver, exchange-traded funds (ETFs), and real-estate property.
Bitcoin is a decentralized digital cryptocurrency that was created in 2009 by an anonymous individual or group using the pseudonym Satoshi Nakamoto. It operates on a technology called blockchain, which is a distributed ledger that records all transactions across a network of computers.


-
 Afghanistan
-
 Albania
-
 Algeria
-
 Argentina
-
 Armenia
-
 Australia
-
 Austria
-
 Azerbaijan
-
 Bahamas
-
 Bahrain
-
 Bangladesh
-
 Belgium
-
 Botswana
-
 Brazil
-
 Brunei
-
 Bulgaria
-
 Burma
Burma
-
 Cambodia
-
 Cameroon
-
 Canada
-
 Chile
Chile
-
 China
China
-
 Colombia
-
 Costa Rica
-
 Cote d'Ivoire
-
 Croatia
-
 Cyprus
-
 Czech Republic
-
 Denmark
-
 Dominican Republic
-
 Ecuador
-
 Egypt
Egypt
-
 Estonia
-
 Eswatini
-
 Ethiopia
-
 Finland
-
 France
-
 Georgia
-
 Germany
-
 Ghana
Ghana
-
 Greece
-
 Haiti
Haiti
-
 Hong Kong
-
 Hungary
-
 India
India
-
 Indonesia
-
 Iran, Islamic republic
-
 Iraq
Iraq
-
 Ireland
-
 Israel
-
 Italy
Italy
-
 Jamaica
-
 Japan
Japan
-
 Jordan
-
 Kazakhstan
-
 Kenya
Kenya
-
 Korea
Korea
-
 Kuwait
-
 Kyrgyzstan
-
 Laos
Laos
-
 Latvia
-
 Lebanon
-
 Libyan Arab Jamahiriya
-
 Lithuania
-
 Luxembourg
-
 Macedonia
-
 Madagascar
-
 Malaysia
-
 Malta
Malta
-
 Mauritius
-
 Mexico
-
 Moldova
-
 Mongolia
-
 Montenegro
-
 Morocco
-
 Mozambique
-
 Namibia
-
 Nepal
Nepal
-
 Netherlands
-
 Nigeria
-
 Norway
-
 Oman
Oman
-
 Pakistan
-
 Palestine
-
 Papua New Guinea
-
 Peru
Peru
-
 Philippines
-
 Poland
-
 Portugal
-
 Puerto Rico
-
 Qatar
Qatar
-
 Romania
-
 Rwanda
-
 Saudi Arabia
-
 Serbia
-
 Singapore
-
 Slovakia
-
 Slovenia
-
 Somalia
-
 South Africa
-
 Spain
Spain
-
 Sri Lanka
-
 Sweden
-
 Switzerland
-
 Syrian Arab Republic
-
 Taiwan
-
 Tajikistan
-
 Tanzania, United Republic Of
-
 Thailand
-
 Trinidad and Tobago
-
 Tunisia
-
 Turkey
-
 UAE
UAE
-
 Uganda
-
 Ukraine
-
 United Kingdom
-
United States
-
 Uzbekistan
-
 Venezuela
-
 Vietnam
-
 Yemen
Yemen
-
 Zambia
-
 Zimbabwe
- Forex
- Crypto
