Top Trend Reversal Signals - Patterns And Indicators


Editorial Note: While we adhere to strict Editorial Integrity, this post may contain references to products from our partners. Here's an explanation for How We Make Money. None of the data and information on this webpage constitutes investment advice according to our Disclaimer.
Best trend reversal signals that every trader should learn:
Head and Shoulders chart pattern.
Double Top and Double Bottom chart pattern.
Rounding Top and Rounding Bottom chart pattern.
Triple Top and Triple Bottom chart pattern.
Falling and Rising Wedge chart pattern.
Moving Averages (MAs) indicator.
MACD indicator.
RSI indicator.
The ability to spot trend reversals is essential for traders. It improves decision-making and boosts success rates. Markets evolve constantly, so understanding patterns and indicators signaling reversals is crucial.
In this guide, TU experts review the top nine trend reversal signals using chart patterns and technical indicators. Mastering these techniques will help you seize opportunities and enhance your trading performance.
What is trend reversal?
A trend reversal occurs when the market changes direction, ending an existing trend and starting a new one. Recognizing these shifts helps traders decide when to enter or exit trades.
To identify a trend reversal:
Watch for changes in price action, like shifts from higher highs and lows to lower highs and lows (or the reverse).
Spot reversal chart patterns, such as Head and Shoulders, Double Top, or Double Bottom.
Use technical indicators like MACD, RSI, or stochastic oscillators to confirm signals.
Combine multiple signals for more accurate analysis and better trade decisions.
Adapt your approach as markets evolve to stay ahead.
Mastering trend reversals increases your chances of making profitable trades in dynamic markets.
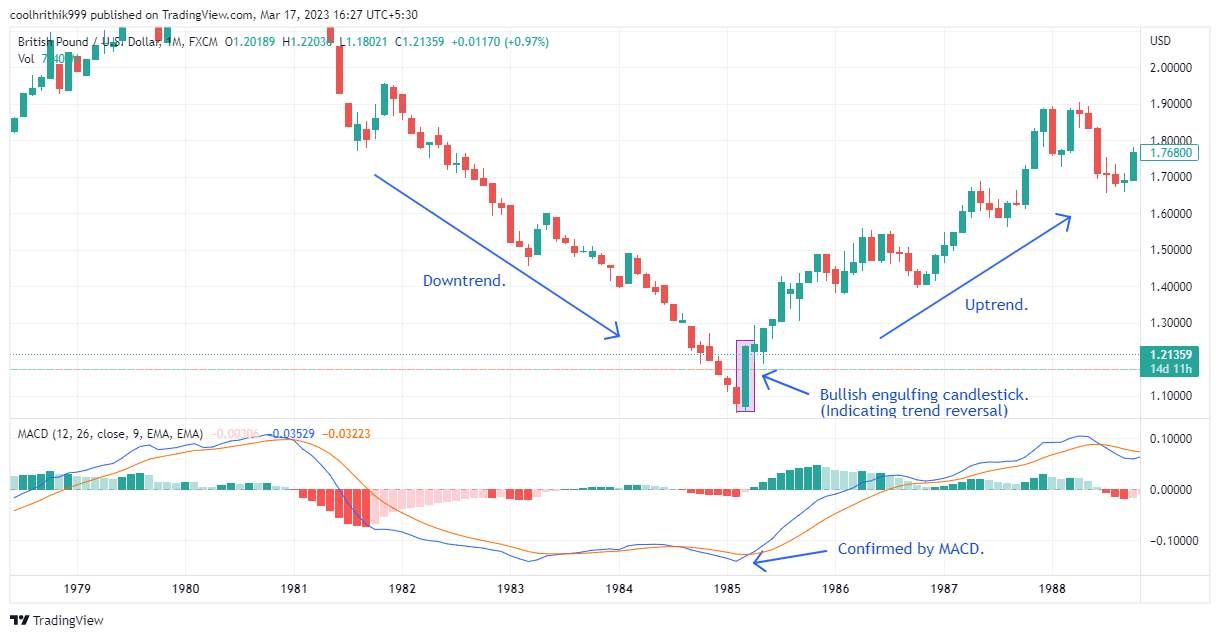
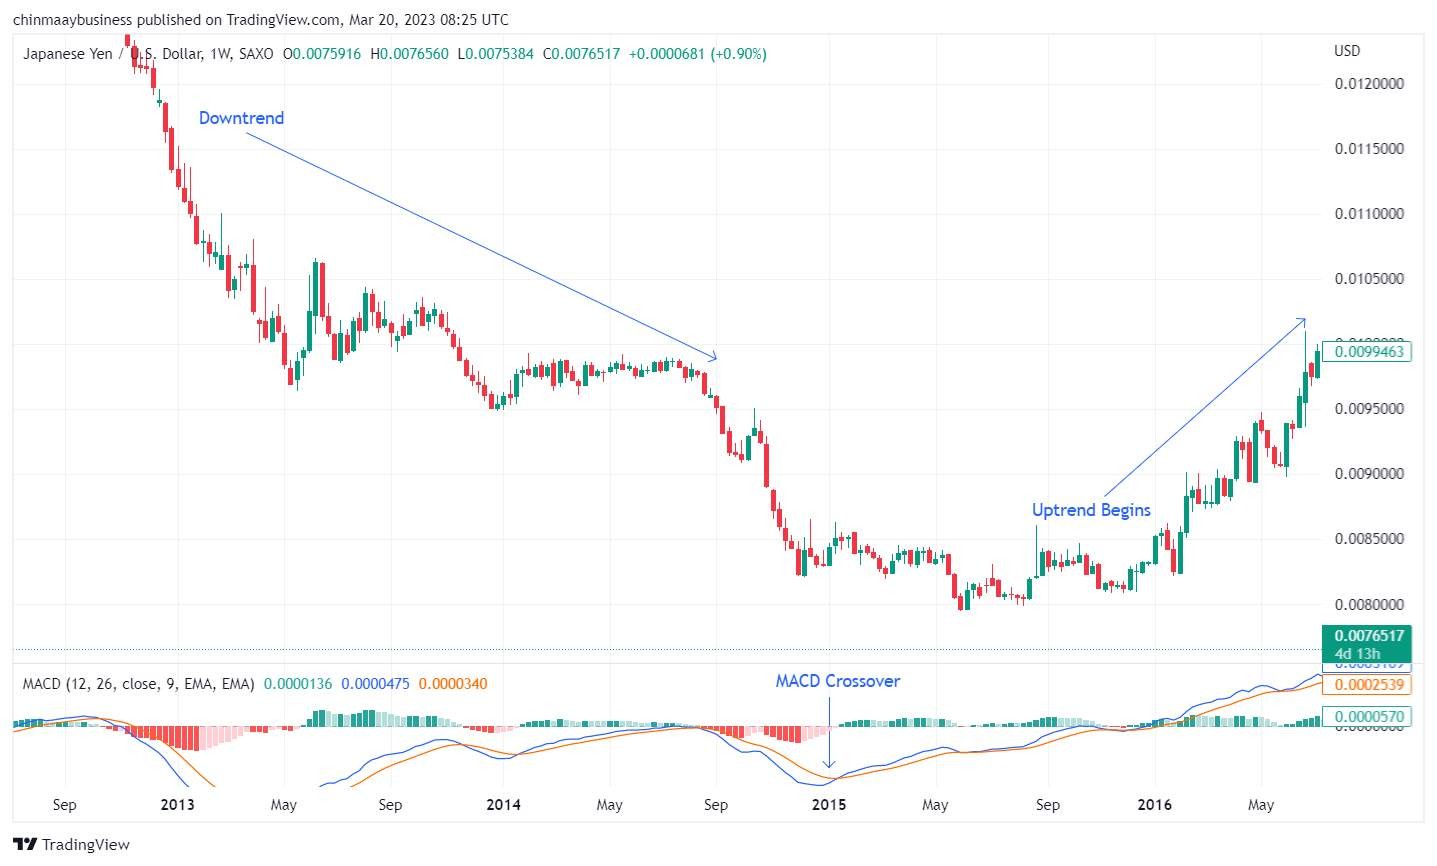
The GBP/USD monthly chart shows a major trend reversal, marked by a bullish engulfing candlestick and a positive MACD crossover, signaling a potential shift to an upward trend.
Best trend reversal patterns
Recognizing trend reversal patterns can give traders an edge. Below, we explore key patterns, their features, and how they signal market shifts.
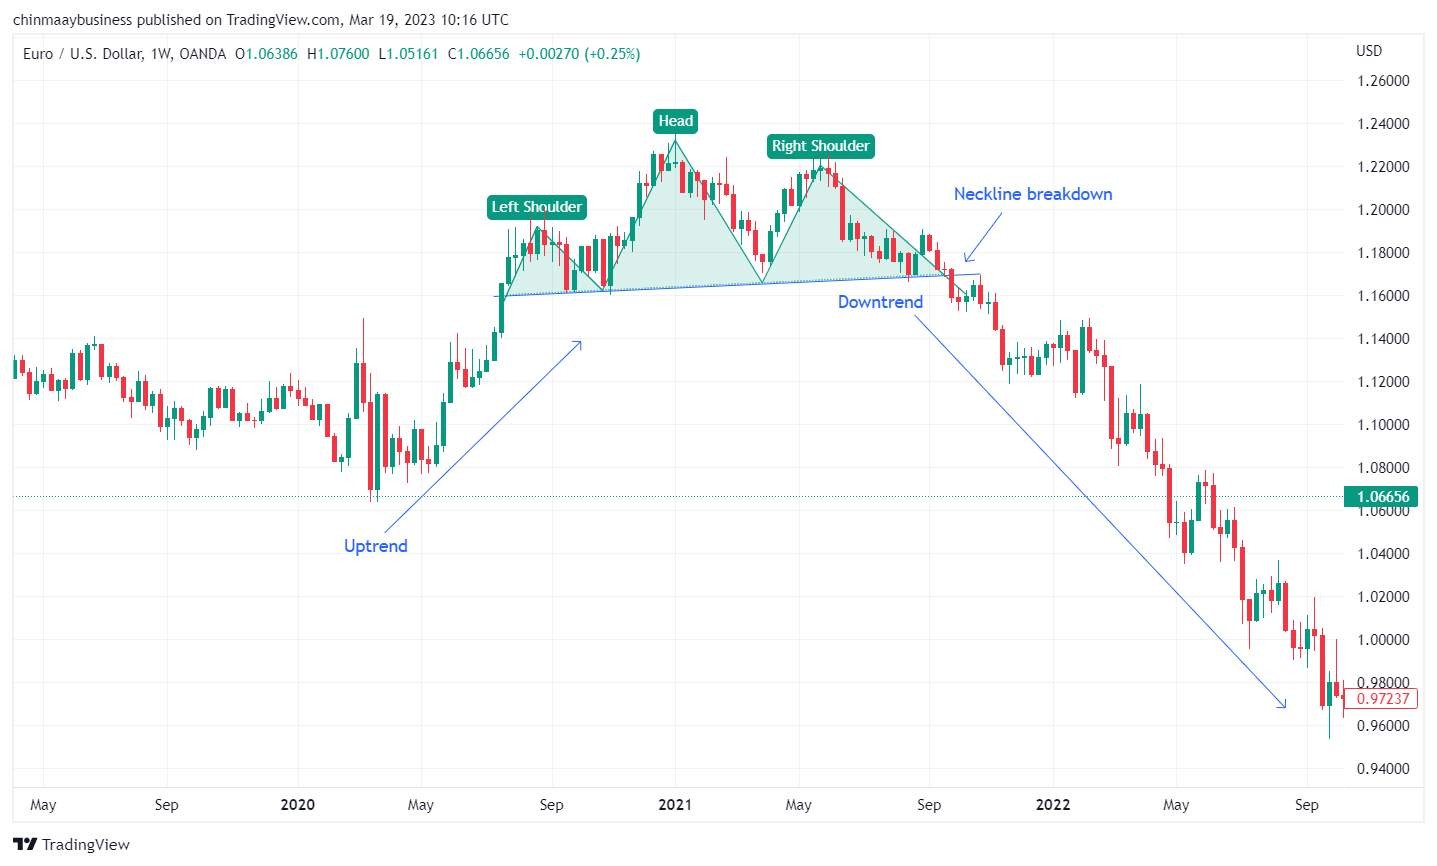
1. Head and shoulders
This pattern signals the end of an uptrend. It has three peaks: the middle (head) is the highest, while the adjacent (shoulders) are lower. The reversal begins when the price breaks the neckline, the support line connecting the two troughs. A neckline breach often signals a shift from bullish to bearish.
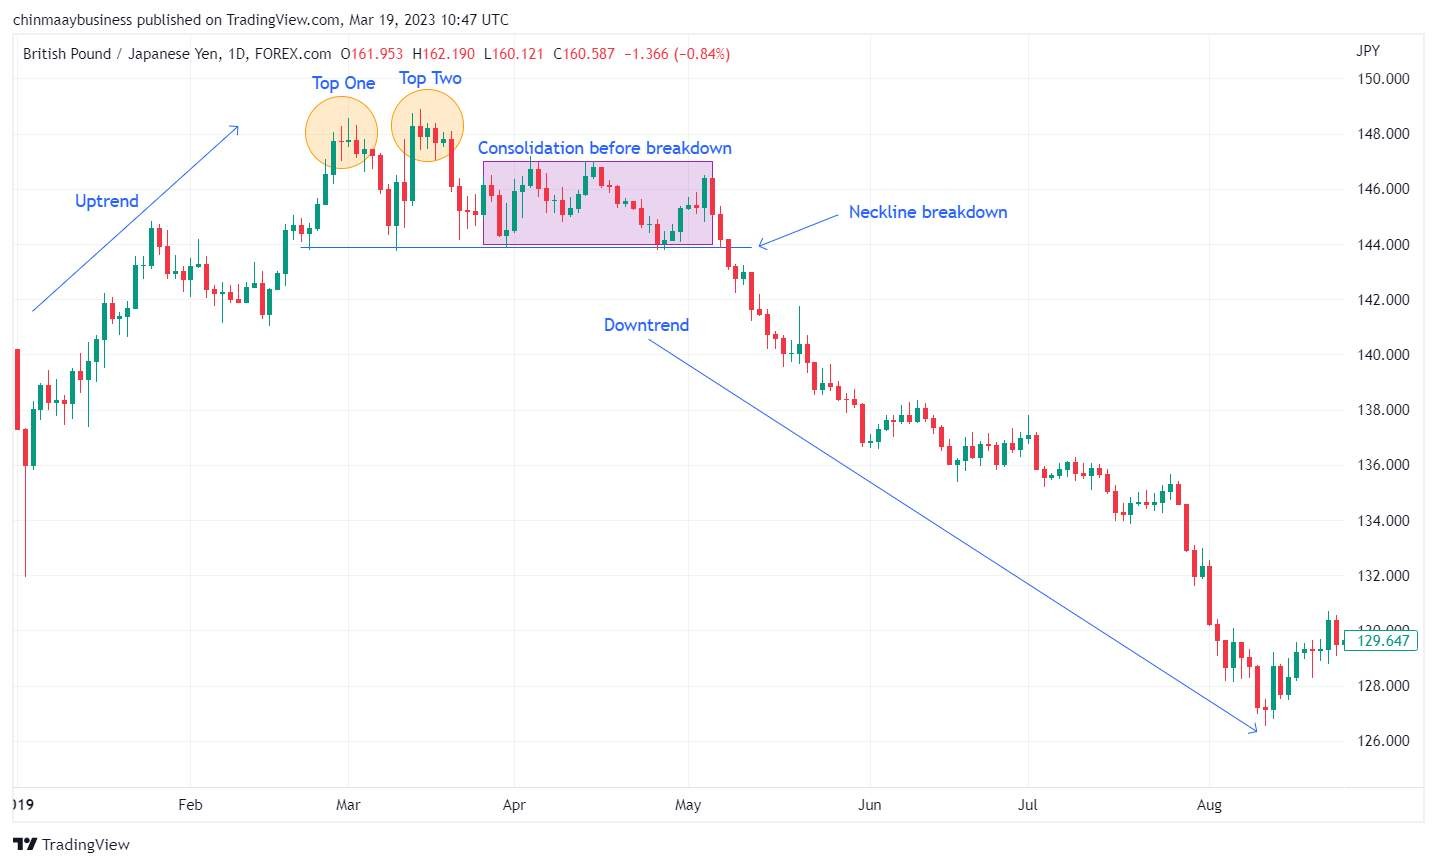
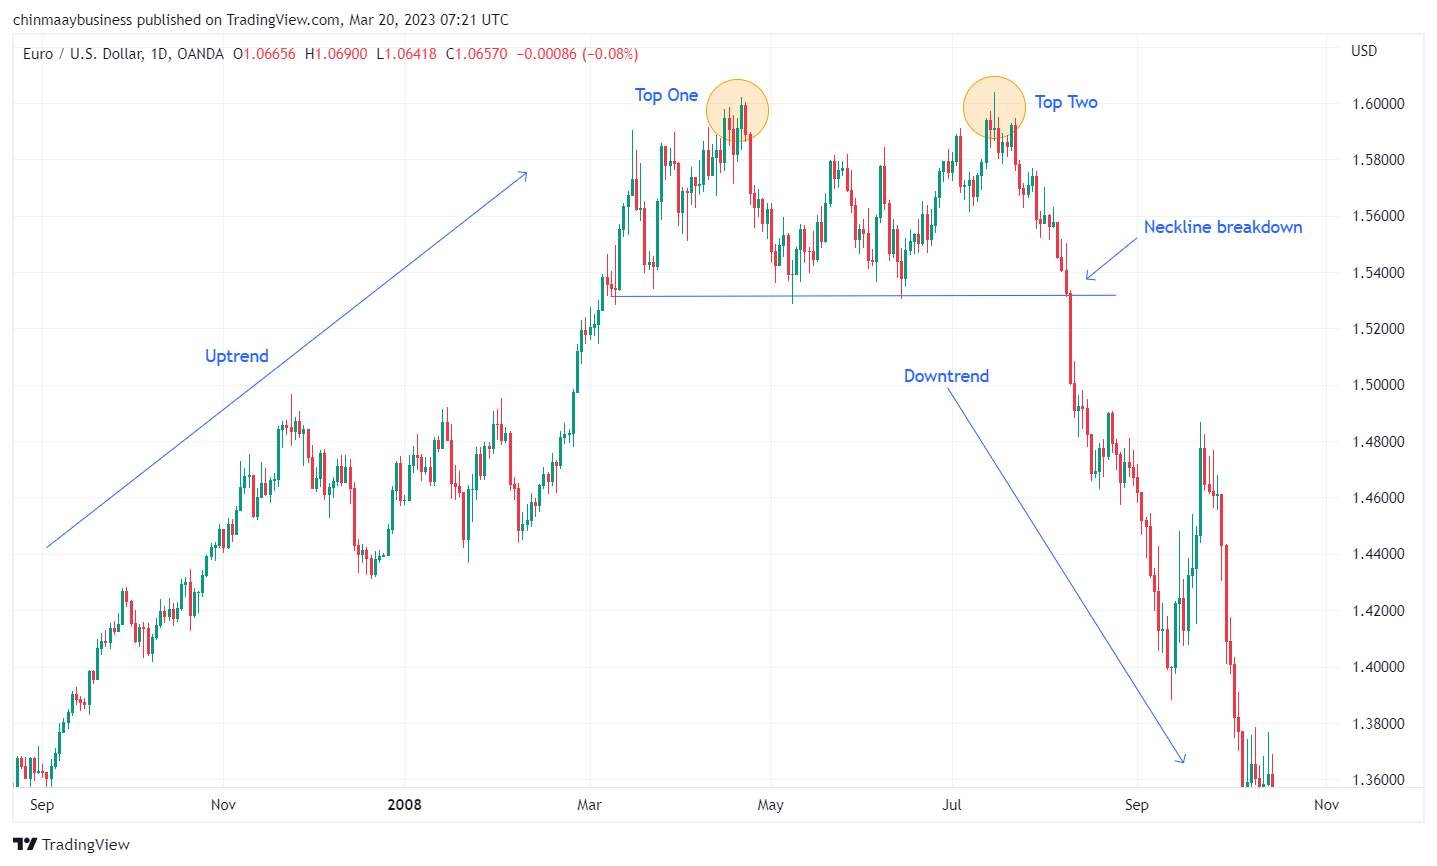
2. Double top and Double bottom
Double Top and Double Bottom are reversal patterns. A Double Top forms when the price hits resistance twice but can’t break through, signaling a potential bearish reversal. In contrast, a Double Bottom forms when the price touches support twice without breaking below, indicating a bullish reversal. The trend reverses once the price breaks the neckline, confirming the pattern.
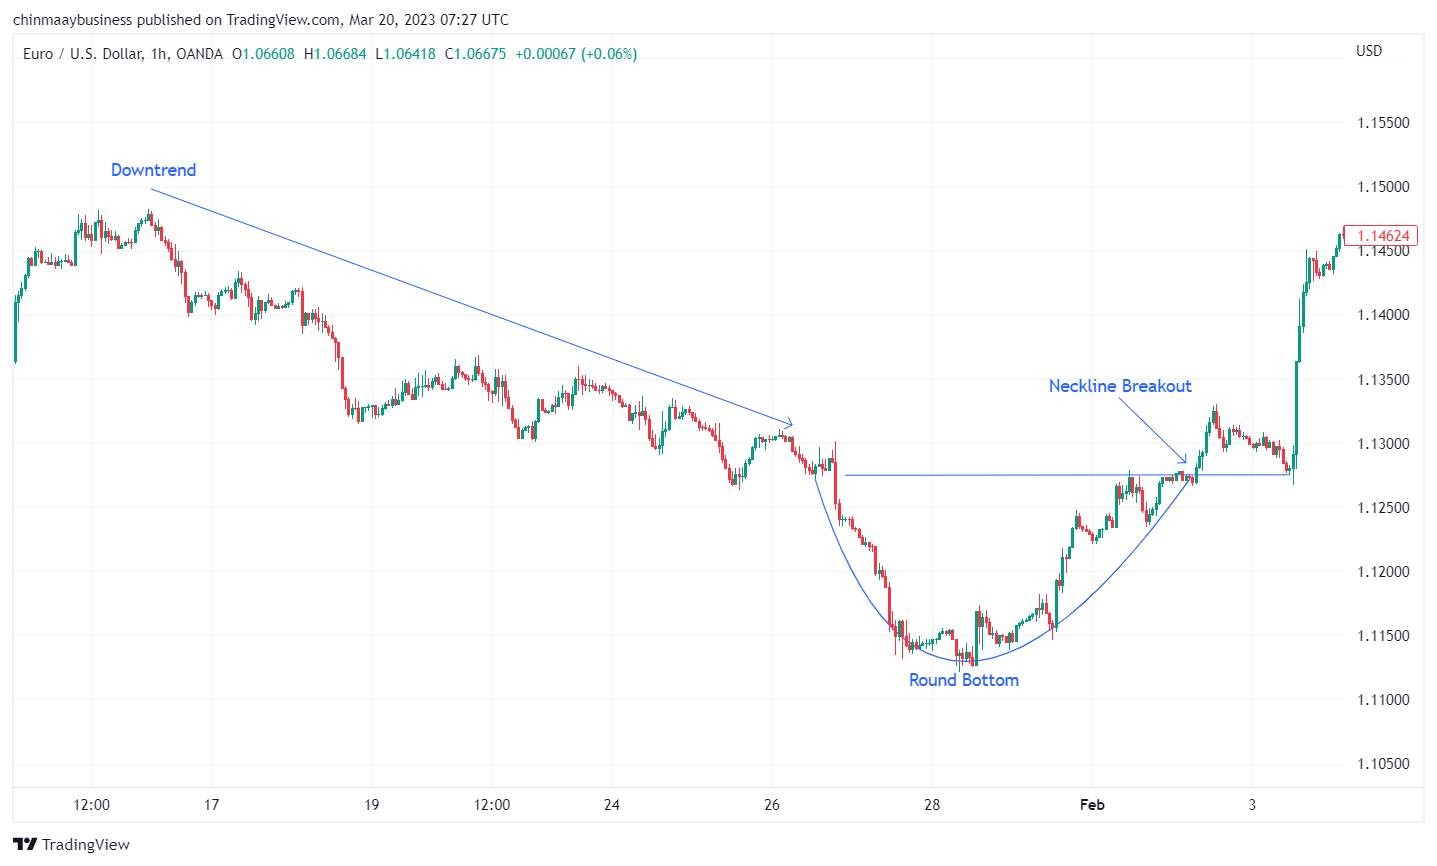
3. Rounding top and Rounding bottom
Rounding Top and Rounding Bottom are gradual reversal patterns. A rounding top forms at the end of an uptrend, curving like a dome, while a rounding bottom forms at the end of a downtrend, resembling a bowl. These patterns show a slow change in market sentiment as buying or selling pressure fades. A trend reversal is confirmed when the price breaks a key support level (rounding top) or resistance level (rounding bottom).
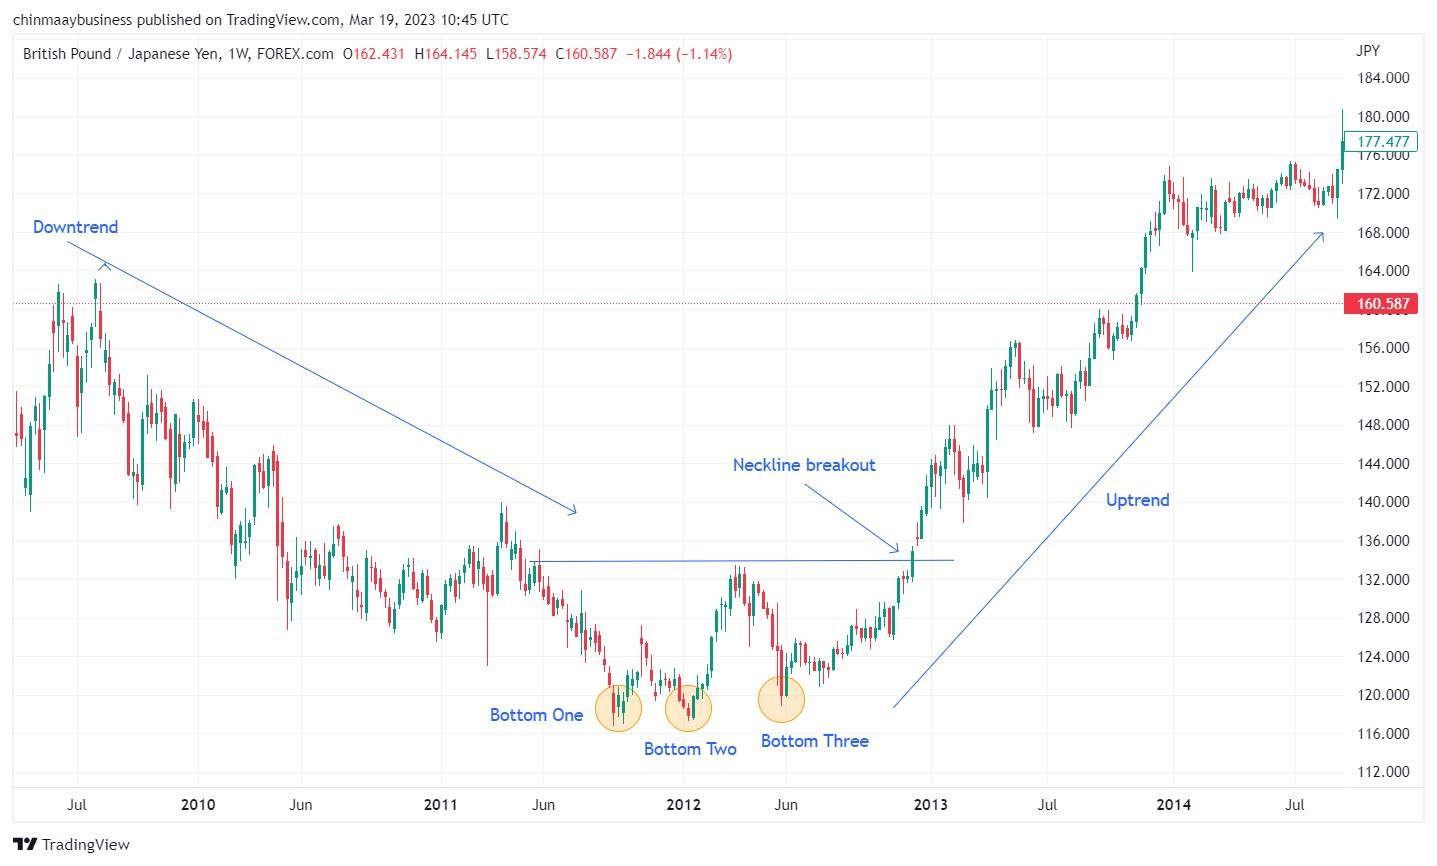
4. Triple top and Triple bottom
Triple Top and Triple Bottom patterns resemble their double-ended versions but have three peaks or troughs. A triple top forms during an uptrend when the price hits resistance three times without breaking it, signaling a potential bearish reversal after breaking the neckline. A triple bottom, formed in a downtrend, indicates a bullish reversal when the price tests support three times before breaking above the neckline.
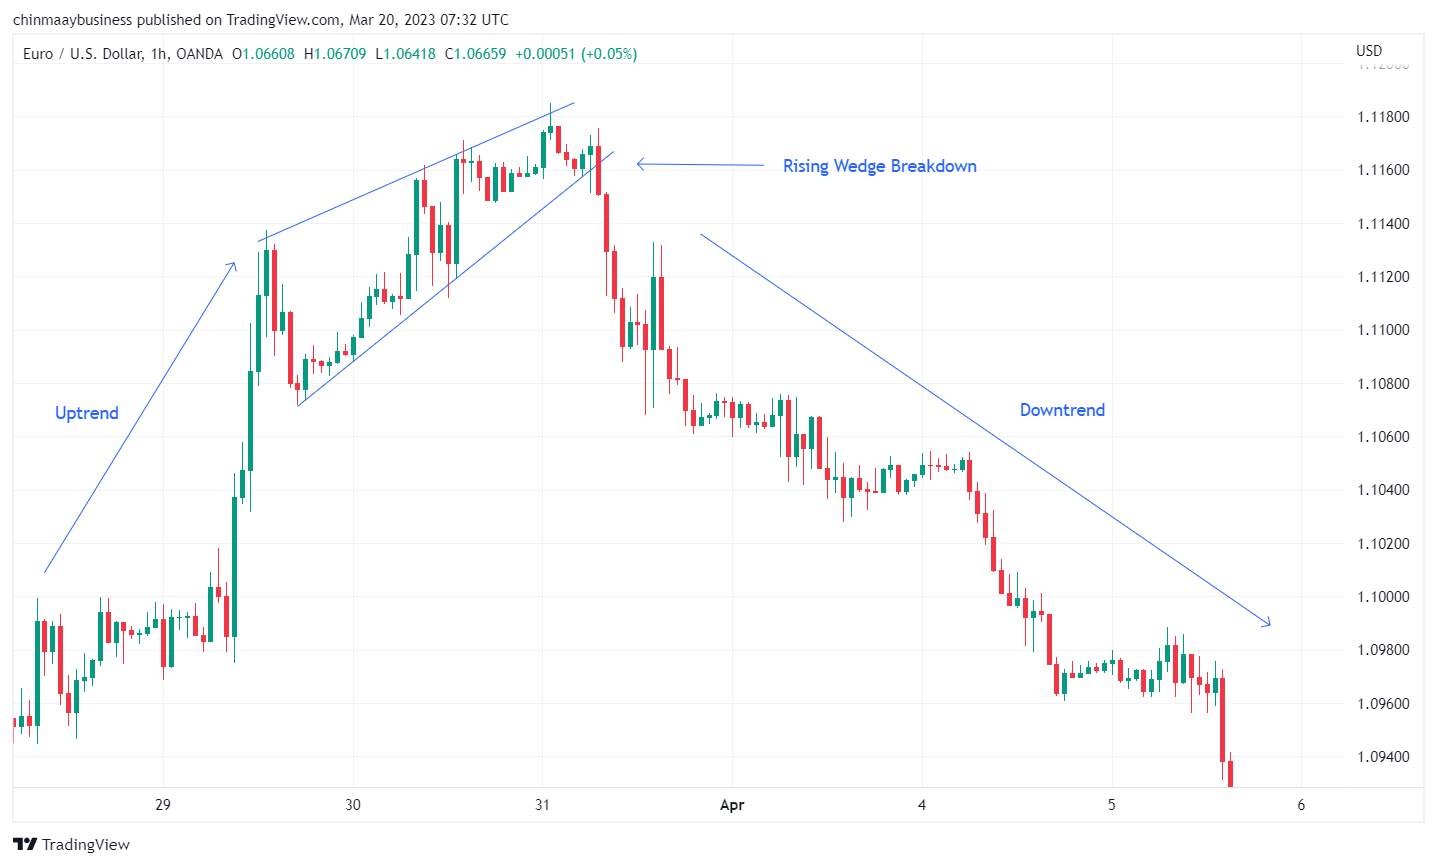
5. Falling and Rising Wedge
Wedge patterns form from converging trend lines and signal trend reversals. A Falling Wedge in a downtrend, with steeper support, often signals a bullish reversal when broken upward. A Rising Wedge in an uptrend with steeper resistance often signals a bearish reversal when broken downward.
Best trend reversal indicators
Traders can use these four trend reversal indicators to identify market shifts. These tools offer insights that help you make better trade decisions. Here's how each works and how to use them effectively.
1. Moving Averages (MAs)
Moving averages are popular and form the basis for indicators like Donchian Channels and Bollinger Bands. They smooth price data, making trends easier to spot.
To identify trend reversals:
Choose a moving average type and period that fits your strategy.
Add it to your chart and observe price movements relative to the MA.
A bullish reversal occurs if the price exceeds the MA after a downtrend. A bearish reversal happens when it crosses below after an uptrend. Using multiple MAs with different periods can strengthen signals and improve accuracy.

2. Bollinger Bands
Bollinger Bands, created by John Bollinger in the 1980s, help traders identify trend reversals and assess market volatility. The indicator consists of three lines: a middle simple moving average (SMA) and two outer bands, representing standard deviations above and below the SMA.
To spot trend reversals using Bollinger Bands:
Add them to your chart with a 20-period SMA and 2 standard deviations (or adjust based on your strategy).
Watch price movements near the bands. A price near the upper band in an uptrend may signal overbought conditions and a possible bearish reversal. In a downtrend, price near the lower band crossing the SMA could indicate a bullish reversal.
Observe band width. Narrow bands (a "Bollinger Squeeze") signal low volatility and often precede significant price changes. Widened bands suggest high volatility, often indicating trend continuation.
This versatile tool helps traders anticipate market shifts and adjust their strategies accordingly.

3. Moving Average Convergence Divergence (MACD)
The MACD is a popular momentum oscillator for spotting trend continuations and reversals. Created by Gerald Appel in the late 1970s, it measures the difference between a short-term and long-term Exponential Moving Average (EMA). A signal line, typically a 9-period EMA of the MACD, helps generate trading signals.
To use the MACD effectively:
Add the MACD to your chart with default settings (12, 26, 9) or adjust them to fit your strategy.
Watch for crossovers between the MACD line (EMA difference) and the signal line. A bullish reversal occurs when the MACD rises above the signal line, while a bearish reversal happens when it falls below.
Monitor the MACD's position relative to the zero line. Crossing above it signals a bullish trend while crossing below suggests a bearish move.
This simple approach helps identify key trend shifts efficiently.
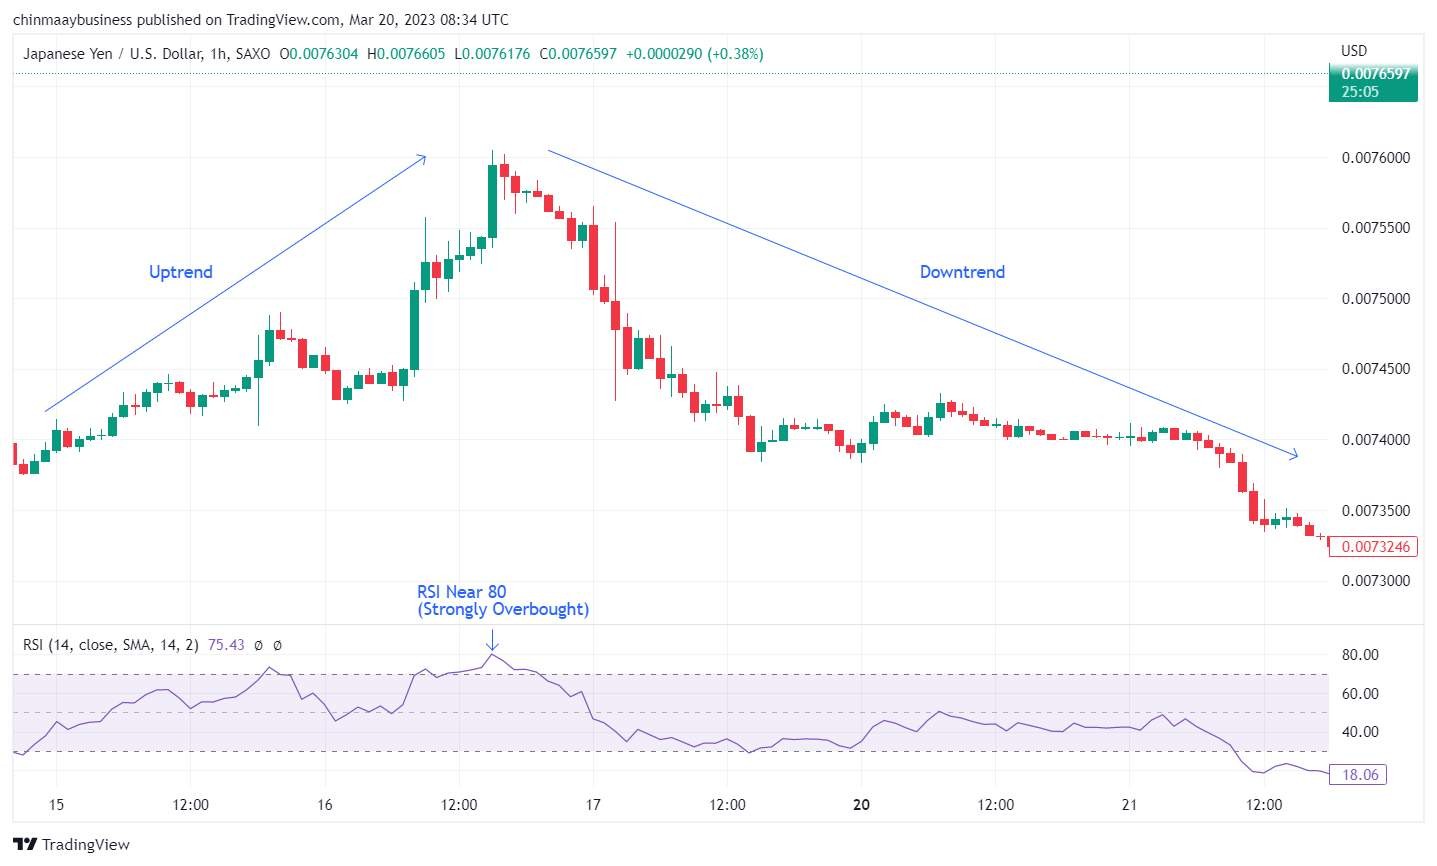
4. Relative Strength Index (RSI)
The Relative Strength Index (RSI) is a popular momentum oscillator that helps traders spot trend reversals. Developed by J. Welles Wilder in 1978, it measures recent price changes to identify overbought or oversold conditions. RSI values range from 0 to 100, with levels above 70 indicating overbought and below 30 suggesting oversold conditions.
To use the RSI effectively:
Add the RSI indicator to your chart, typically set to a 14-period default, but adjust as needed for your strategy.
Watch for overbought (above 70) and oversold (below 30) levels. For stronger reversal signals, use extreme levels like 80/20 or 90/10.
Combine RSI with other tools, such as support/resistance levels or trend lines, for better accuracy. Multiple indicators enhance reliability and improve trading decisions.
How to identify trend reversal signals correctly?
To spot trend reversal signals accurately, use a mix of techniques and confirm them with multiple indicators.
Combine multiple indicators. Tools like moving averages, Bollinger Bands, MACD, and RSI work better together. Their combined signals reduce the risk of false reversals and improve reliability.
Look for confirmation. Don’t act on a single signal. For example, confirm a moving average crossover with RSI or MACD to ensure the reversal is valid.
Watch support and resistance levels. A price breakout from key levels can signal a trend shift. Breaking support in a downtrend may hint at a bullish reversal while breaking resistance in an uptrend could suggest a bearish reversal.
Monitor trend lines. Long-term trend line breaks are strong reversal indicators. A break above a descending line in a downtrend suggests a bullish turn, while a break below an ascending line in an uptrend signals a bearish move.
Trend reversal vs. retracement - what’s the difference?
In trading, understanding trend reversals and retracements is essential. Both indicate price direction changes, but their duration and impact differ.
Reversal
A reversal marks a significant, long-term price direction change. For instance, if a stock climbs for months and then consistently declines, it's likely a reversal.
Retracement
A retracement is a temporary price dip within a larger trend. For example, a stock rising for months may briefly drop before resuming its upward trend.
Key differences:
Volume. Retracements involve lower trading activity; reversals show a surge in volume.
Money flow. Retracements see consistent buying and selling, while reversals show declining interest.
Chart patterns. Retracements cause minor chart changes, while reversals form distinct patterns signaling trend shifts.
Time frame. Retracements are short, lasting days to weeks. Reversals persist for weeks or months.
Fundamentals. Retracements don't alter underlying value; reversals often involve changing fundamentals.
Candlesticks. Retracements show indecision patterns, whereas reversals display clear signals of direction change.
Risk management and trend reversal signals
Risk management is essential when trading trend reversals. Using tools like stop-loss orders and the cancellation model helps limit losses and maximize profits. Here's how to apply them effectively:
Risk management tools
Stop-loss orders. Close trades automatically at a set price to limit losses.
Position sizing. Risk only 1%-3% of your capital per trade to protect your portfolio.
Risk-reward ratio. Ensure potential profits are at least double or triple potential losses.
Diversification. Spread trades across assets or sectors to reduce portfolio risks.
Using the cancellation model
Fill or kill (FOK). Cancels orders that can’t be fully filled immediately, avoiding partial trades.
Immediate or cancel (IOC). Cancels unfilled portions of an order while allowing partial execution.
One-cancels-the-other (OCO). Links two orders; executing one cancels the other, reducing unwanted risks.
By combining these tools and models, you can trade trend reversals with confidence while safeguarding your portfolio.
Best Forex brokers
Choosing the best Forex broker is essential for traders seeking reliable platforms, competitive fees, and effective tools to navigate the dynamic currency market. Here are leading Forex brokers you should consider.
| Demo | Min. deposit, $ | Min Spread EUR/USD, pips | Max Spread EUR/USD, pips | Deposit fee, % | Withdrawal fee, % | Max. Regulation Level | Open an account | |
|---|---|---|---|---|---|---|---|---|
| Yes | 100 | 0,5 | 0,9 | No | No | Tier-1 | Open an account Your capital is at risk. |
|
| Yes | No | 0,5 | 1,5 | No | No | Tier-1 | Open an account Your capital is at risk.
|
|
| Yes | No | 0,1 | 0,5 | No | No | Tier-1 | Open an account Your capital is at risk. |
|
| Yes | 100 | 0,7 | 1,2 | No | No | Tier-1 | Study review | |
| Yes | No | 0,2 | 0,8 | No | Yes | Tier-1 | Open an account Your capital is at risk. |
Spotting reversals with volume spikes and rare indicators

Spotting trend reversals isn’t just about using popular tools like moving averages. Watch for sudden volume spikes when prices move sideways for a while. If the price forms patterns like a bullish engulfing candle alongside increased volume, a reversal may be near. Another tip is tracking unusual buying or selling activity, which often signals big players entering the market.
Also, check less-known indicators like the Klinger Volume Oscillator, which mixes price and volume trends. If it moves opposite to the price while the market seems stuck, a trend change could be coming. Pay attention to market open and close times, when price shifts tend to happen most. Combining these tips can improve your reversal-tracking game.
Conclusion
Understanding trend reversal signals helps traders make smarter market decisions. Key indicators like Moving Averages, Bollinger Bands, MACD, and RSI are highly effective. Combining these tools with an analysis of support and resistance levels, trendlines, and price action enhances accuracy. Ultimately, using risk management strategies such as canceled orders minimizes losses and improves performance.
FAQs
What is a trend reversal signal?
A trend reversal signal is an indication that the current price trend of an asset is about to change its direction, either from an uptrend to a downtrend or vice versa.
What is the best indicator for trend reversal?
There is no single best indicator for trend reversal, as it often depends on individual trading styles and preferences. Commonly used indicators include moving averages, Bollinger bands, MACD, and RSI.
How do you identify a trend reversal in trading?
To identify a trend reversal in trading, traders can combine various technical analysis tools such as trend reversal indicators, support and resistance levels, long-term trendlines, and price action patterns.
What are trend reversal strategies?
Trend reversal strategies are trading approaches designed to capitalize on market situations when a prevailing price trend is about to change direction.
Related Articles
Team that worked on the article
Peter Emmanuel Chijioke is a professional personal finance, Forex, crypto, blockchain, NFT, and Web3 writer and a contributor to the Traders Union website. As a computer science graduate with a robust background in programming, machine learning, and blockchain technology, he possesses a comprehensive understanding of software, technologies, cryptocurrency, and Forex trading.
Having skills in blockchain technology and over 7 years of experience in crafting technical articles on trading, software, and personal finance, he brings a unique blend of theoretical knowledge and practical expertise to the table. His skill set encompasses a diverse range of personal finance technologies and industries, making him a valuable asset to any team or project focused on innovative solutions, personal finance, and investing technologies.
Chinmay Soni is a financial analyst with more than 5 years of experience in working with stocks, Forex, derivatives, and other assets. As a founder of a boutique research firm and an active researcher, he covers various industries and fields, providing insights backed by statistical data. He is also an educator in the field of finance and technology.
As an author for Traders Union, he contributes his deep analytical insights on various topics, taking into account various aspects.
Mirjan Hipolito is a journalist and news editor at Traders Union. She is an expert crypto writer with five years of experience in the financial markets. Her specialties are daily market news, price predictions, and Initial Coin Offerings (ICO).
Day trading involves buying and selling financial assets within the same trading day, with the goal of profiting from short-term price fluctuations, and positions are typically not held overnight.
The deviation is a statistical measure of how much a set of data varies from the mean or average value. In forex trading, this measure is often calculated using standard deviation that helps traders in assessing the degree of variability or volatility in currency price movements.
Risk management in Forex involves strategies and techniques used by traders to minimize potential losses while trading currencies, such as setting stop-loss orders and position sizing, to protect their capital from adverse market movements.
Uptrend is a market condition in which prices are generally rising. Uptrends can be identified by using moving averages, trendlines, and support and resistance levels.
Index in trading is the measure of the performance of a group of stocks, which can include the assets and securities in it.


-
 Afghanistan
-
 Albania
-
 Algeria
-
 Argentina
-
 Armenia
-
 Australia
-
 Austria
-
 Azerbaijan
-
 Bahamas
-
 Bahrain
-
 Bangladesh
-
 Belgium
-
 Botswana
-
 Brazil
-
 Brunei
-
 Bulgaria
-
 Burma
Burma
-
 Cambodia
-
 Cameroon
-
 Canada
-
 Chile
Chile
-
 China
China
-
 Colombia
-
 Costa Rica
-
 Cote d'Ivoire
-
 Croatia
-
 Cyprus
-
 Czech Republic
-
 Denmark
-
 Dominican Republic
-
 Ecuador
-
 Egypt
Egypt
-
 Estonia
-
 Eswatini
-
 Ethiopia
-
 Finland
-
 France
-
 Georgia
-
 Germany
-
 Ghana
Ghana
-
 Greece
-
 Haiti
Haiti
-
 Hong Kong
-
 Hungary
-
 India
India
-
 Indonesia
-
 Iran, Islamic republic
-
 Iraq
Iraq
-
 Ireland
-
 Israel
-
 Italy
Italy
-
 Jamaica
-
 Japan
Japan
-
 Jordan
-
 Kazakhstan
-
 Kenya
Kenya
-
 Korea
Korea
-
 Kuwait
-
 Kyrgyzstan
-
 Laos
Laos
-
 Latvia
-
 Lebanon
-
 Libyan Arab Jamahiriya
-
 Lithuania
-
 Luxembourg
-
 Macedonia
-
 Madagascar
-
 Malaysia
-
 Malta
Malta
-
 Mauritius
-
 Mexico
-
 Moldova
-
 Mongolia
-
 Montenegro
-
 Morocco
-
 Mozambique
-
 Namibia
-
 Nepal
Nepal
-
 Netherlands
-
 Nigeria
-
 Norway
-
 Oman
Oman
-
 Pakistan
-
 Palestine
-
 Papua New Guinea
-
 Peru
Peru
-
 Philippines
-
 Poland
-
 Portugal
-
 Puerto Rico
-
 Qatar
Qatar
-
 Romania
-
 Rwanda
-
 Saudi Arabia
-
 Serbia
-
 Singapore
-
 Slovakia
-
 Slovenia
-
 Somalia
-
 South Africa
-
 Spain
Spain
-
 Sri Lanka
-
 Sweden
-
 Switzerland
-
 Syrian Arab Republic
-
 Taiwan
-
 Tajikistan
-
 Tanzania, United Republic Of
-
 Thailand
-
 Trinidad and Tobago
-
 Tunisia
-
 Turkey
-
 UAE
UAE
-
 Uganda
-
 Ukraine
-
 United Kingdom
-
United States
-
 Uzbekistan
-
 Venezuela
-
 Vietnam
-
 Yemen
Yemen
-
 Zambia
-
 Zimbabwe
- Forex
- Crypto
