

U.S. crude prices signal possible downside in current range

U.S. crude oil is holding near the upper end of its yearly trading range as chart patterns point to limited scope for further gains. Unfilled price gaps left by volatile moves during the Iran war suggest traders may increasingly look to lower levels as potential downside targets.
Highlights
- Technical analysis of West Texas Intermediate crude shows two unfilled chart gaps below the current $100 price, indicating possible downside targets.
- The nearest gap spans from the Aug. 28 close at $83.40 to the Aug. 31 open at $84.69, while a larger gap remains partly open between $67.02 and $75.00.
- With U.S. crude struggling near the top of its annual range, unfilled gaps below current prices increase the likelihood of downward movement unless new supply disruptions arise.
Chart gaps highlight downside targets
As reported by Reuters, technical analysis of West Texas Intermediate suggests the market may face downward pressure because two price gaps below current levels remain partly or fully unfilled.Technical analysis uses past price moves to identify patterns that may indicate where a market goes next. One of those patterns is a gap, which forms when prices rise or fall so quickly that trading skips a band of prices, leaving an empty space on the chart. Many analysts expect markets eventually to trade back through those skipped levels.
The gap closest to the market, with U.S. crude trading around $100, sits between the Aug. 28 close of $83.40 and the Aug. 31 open of $84.69. A second, larger gap lies between the Feb. 27 close of $67.02 and the March 2 open of $75.00, although that one has been partially filled already.
Range ceiling keeps market in focus
Support and resistance levels remain central to how traders read the market. Support can act like a floor under prices, while resistance can act like a ceiling that limits gains, and gaps can also serve as support, resistance or trading targets.Trading during the Iran war left several gaps on the U.S. oil chart, most of which have since been filled. The remaining gaps sit below current prices, reinforcing the view that the path of least resistance may be downward if crude continues to stall near the top of its annual range.
That signal is not definitive, because gaps can stay open for extended periods and any prolonged conflict or supply disruption could keep crude prices elevated. Still, with the market struggling to break higher, the unfilled zones provide sellers with clear levels to watch.
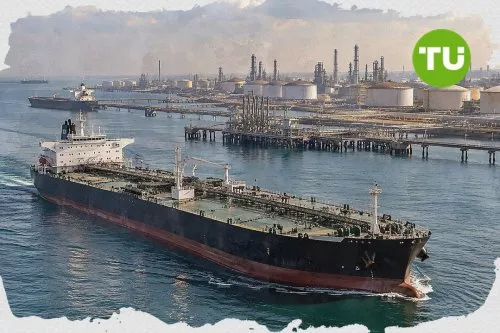
Conflict-driven disruption in oil tanker routes has pushed crude shipping and insurance costs sharply higher, making freight a much larger component of the delivered oil price. Our earlier report noted that attacks and rerouting away from chokepoints like the Strait of Hormuz and the Red Sea have driven record per-barrel transport costs, squeezing importers and refiners while boosting tanker owners’ earnings.






Latest WTI News



-
 Afghanistan
-
 Albania
-
 Algeria
-
 Angola
-
 Argentina
-
 Armenia
-
 Australia
-
 Austria
-
 Azerbaijan
-
 Bahamas
-
 Bahrain
-
 Bangladesh
-
 Belarus
-
 Belgium
-
 Bolivia
-
 Botswana
-
 Brazil
-
 Brunei
-
 Bulgaria
-
 Cambodia
-
 Cameroon
-
 Canada
-
 Chile
-
 China
-
 Colombia
-
 Congo
-
 Costa Rica
-
 Cote d'Ivoire
-
 Croatia
-
 Cuba
-
 Cyprus
-
 Czechia
-
 DR Congo
-
 Denmark
-
 Dominican Republic
-
 Ecuador
-
 Egypt
-
 El Salvador
-
 Estonia
-
 Eswatini
-
 Ethiopia
-
 Finland
-
 France
-
 Georgia
-
 Germany
-
 Ghana
-
 Greece
-
 Haiti
-
 Hong Kong
-
 Hungary
-
 India
-
 Indonesia
-
 Iran, Islamic republic
-
 Iraq
-
 Ireland
-
 Israel
-
 Italy
-
 Jamaica
-
 Japan
-
 Jordan
-
 Kazakhstan
-
 Kenya
-
 Korea
-
 Kuwait
-
 Kyrgyzstan
-
 Laos
-
 Latvia
-
 Lebanon
-
 Lesotho
-
 Libya
-
 Lithuania
-
 Luxembourg
-
 Madagascar
-
 Malaysia
-
 Malta
-
 Mauritius
-
 Mexico
-
 Moldova
-
 Mongolia
-
 Montenegro
-
 Morocco
-
 Mozambique
-
 Myanmar
-
 Namibia
-
 Nepal
-
 Netherlands
-
 New Zealand
-
 Nigeria
-
 North Macedonia
-
 Norway
-
 Oman
-
 Pakistan
-
 Palestine
-
 Panama
-
 Papua New Guinea
-
 Paraguay
-
 Peru
-
 Philippines
-
 Poland
-
 Portugal
-
 Puerto Rico
-
 Qatar
-
 Reunion
-
 Romania
-
 Rwanda
-
 Saudi Arabia
-
 Serbia
-
 Singapore
-
 Slovakia
-
 Slovenia
-
 Somalia
-
 South Africa
-
 Spain
-
 Sri Lanka
-
 Sweden
-
 Switzerland
-
 Syria
-
 Taiwan
-
 Tajikistan
-
 Tanzania
-
 Thailand
-
 Trinidad and Tobago
-
 Tunisia
-
 Turkey
-
 UAE
-
 Uganda
-
 Ukraine
-
 United Kingdom
-
United States
-
 Uruguay
-
 Uzbekistan
-
 Venezuela
-
 Vietnam
-
 Yemen
-
 Zambia
-
 Zimbabwe
- Forex
- Crypto












