
Can dividend payout boost and buybacks drive CME Group stock higher?

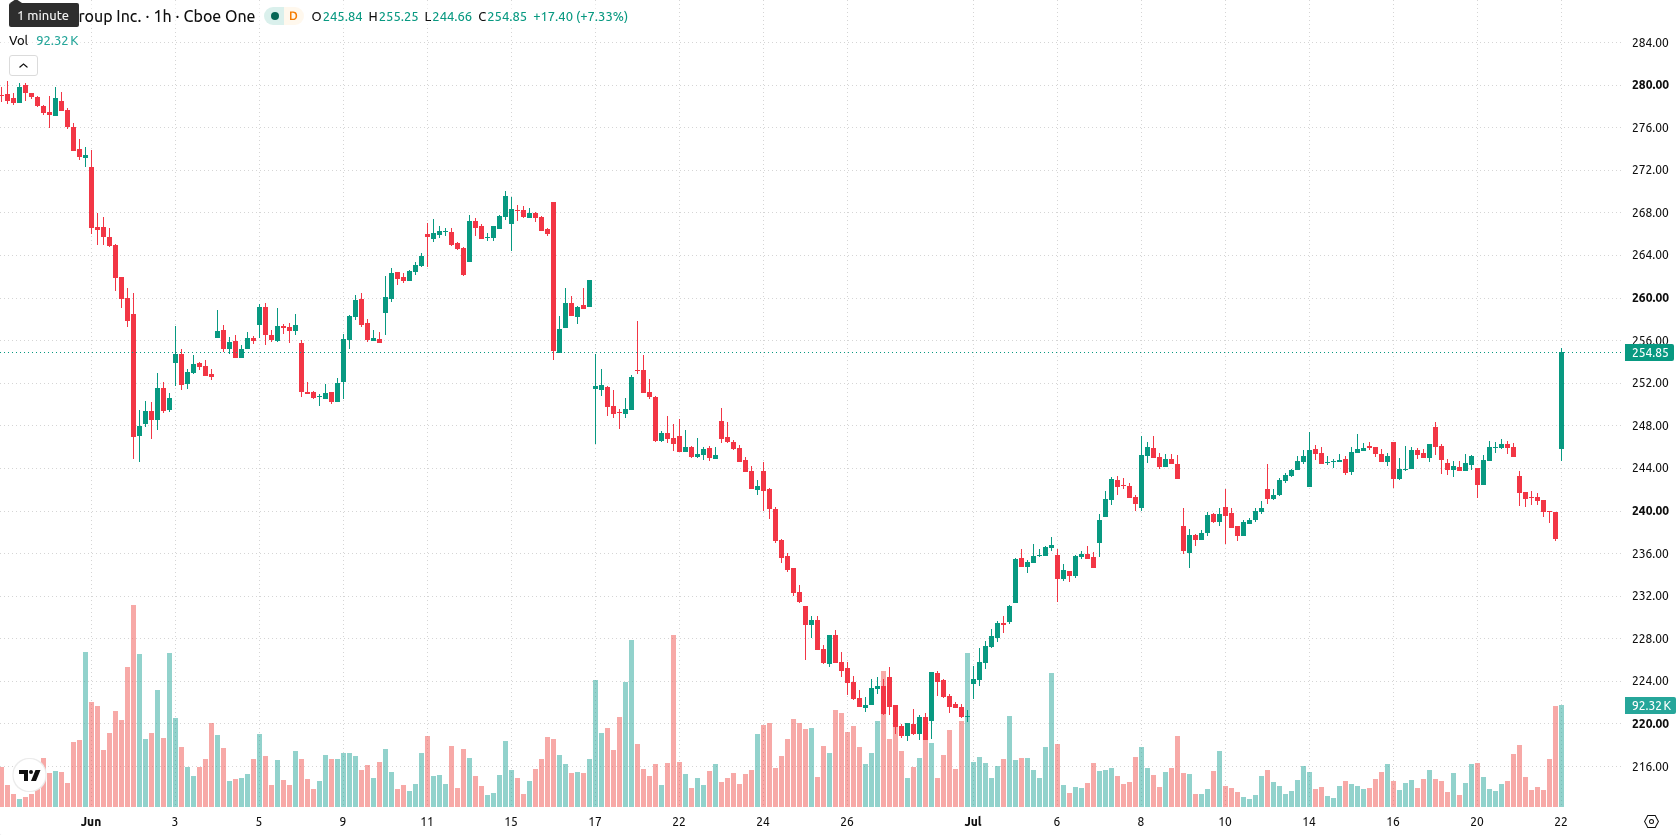
CME Group (CME) stock is trading at $253.16, having climbed 6.65% today. The price is positioned above its key short- and medium-term moving averages, although it is still below the long-term trend indicator.
 256.58
257.53
256.58
257.53
Highlights
- CME Group reported Q2 2026 net income of $1.04 billion on $1.7 billion revenue, reinforcing robust profitability and bullish market sentiment.
- Shareholder value was supported by $468 million in dividends and $695 million in buybacks, alongside continued strength in global trading volumes.
- Technically, CME/USD trades with strong short-term momentum and high volatility, but mixed indicator signals suggest risk of near-term mean reversion within a projected $235.62 to $258.04 range.
Bullish sentiment strengthened by earnings and capital returns
CME Group has released its Q2 2026 financial results, reporting total revenue of $1.7 billion and net income of $1.04 billion, which highlights robust profitability and underpins the current bullish sentiment, according to PR Newswire. The quarter featured active capital returns, including $468 million paid out in dividends and $695 million in share repurchases, steps that directly enhance shareholder value and support the stock. Results were further complemented by strong trading performance, with average daily volumes reaching 29.8 million contracts driven by both U.S. and international activity, as reported by Tradingview. Together, these confirmed developments have created a supportive fundamental backdrop for CME's upward momentum this session.
Buyers dominate as momentum remains mixed and overextended
On the technical front, CME is trading above both its MA-20 at $243.31 and MA-50 at $244.08, while still remaining below the longer-term MA-200 at $278.85 on the daily timeframe. The Ichimoku Kijun level, now at $242.84, offers immediate support. Among momentum indicators, MACD signals a Sell and ADX is Neutral, reflecting limited trend clarity intraday. Conversely, both RSI and CCI are showing Buy signals, while Stoch RSI and Bull/Bear Power are registering overbought conditions, highlighting the dominance of buyers in the session. The mixed oscillator readings accentuate short-term bullishness but also caution that the rally has reached overextended levels, raising the risk for a technical pullback or consolidation despite lingering upside momentum.
Range-bound outlook as volatility persists and breakout risk grows
Over the next few trading days, CME is expected to fluctuate within the $235.62 to $258.04 band, consistent with typical volatility at current levels. Model projections assign a 77% probability to further upward movement, while the probability of a downside scenario stands at 23%. The baseline expectation is for price consolidation inside this range, with a possible bullish breakout above resistance extending gains, or, should support fail, a bearish scenario where sellers regain control.
Previously it was reported that CME Group exhibited ongoing bearish momentum with little expectation for a sustained rebound. The recent technical and fundamental improvements now highlight a shift toward buyer dominance, making a potential bullish breakout above current resistance the key scenario for investors to monitor.


Latest CME Group News






-
 Afghanistan
-
 Albania
-
 Algeria
-
 Angola
-
 Argentina
-
 Armenia
-
 Australia
-
 Austria
-
 Azerbaijan
-
 Bahamas
-
 Bahrain
-
 Bangladesh
-
 Belarus
-
 Belgium
-
 Bolivia
-
 Botswana
-
 Brazil
-
 Brunei
-
 Bulgaria
-
 Cambodia
-
 Cameroon
-
 Canada
-
 Chile
Chile
-
 China
China
-
 Colombia
-
 Congo
Congo
-
 Costa Rica
-
 Cote d'Ivoire
-
 Croatia
-
 Cuba
Cuba
-
 Cyprus
-
 Czechia
-
 DR Congo
-
 Denmark
-
 Dominican Republic
-
 Ecuador
-
 Egypt
Egypt
-
 El Salvador
-
 Estonia
-
 Eswatini
-
 Ethiopia
-
 Finland
-
 France
-
 Georgia
-
 Germany
-
 Ghana
Ghana
-
 Greece
-
 Haiti
Haiti
-
 Hong Kong
-
 Hungary
-
 India
India
-
 Indonesia
-
 Iran, Islamic republic
-
 Iraq
Iraq
-
 Ireland
-
 Israel
-
 Italy
Italy
-
 Jamaica
-
 Japan
Japan
-
 Jordan
-
 Kazakhstan
-
 Kenya
Kenya
-
 Korea
Korea
-
 Kuwait
-
 Kyrgyzstan
-
 Laos
Laos
-
 Latvia
-
 Lebanon
-
 Lesotho
-
 Libya
Libya
-
 Lithuania
-
 Luxembourg
-
 Madagascar
-
 Malaysia
-
 Malta
Malta
-
 Mauritius
-
 Mexico
-
 Moldova
-
 Mongolia
-
 Montenegro
-
 Morocco
-
 Mozambique
-
 Myanmar
-
 Namibia
-
 Nepal
Nepal
-
 Netherlands
-
 New Zealand
-
 Nigeria
-
 North Macedonia
-
 Norway
-
 Oman
Oman
-
 Pakistan
-
 Palestine
-
 Panama
-
 Papua New Guinea
-
 Paraguay
-
 Peru
Peru
-
 Philippines
-
 Poland
-
 Portugal
-
 Puerto Rico
-
 Qatar
Qatar
-
 Reunion
-
 Romania
-
 Rwanda
-
 Saudi Arabia
-
 Serbia
-
 Singapore
-
 Slovakia
-
 Slovenia
-
 Somalia
-
 South Africa
-
 Spain
Spain
-
 Sri Lanka
-
 Sweden
-
 Switzerland
-
 Syria
Syria
-
 Taiwan
-
 Tajikistan
-
 Tanzania
-
 Thailand
-
 Trinidad and Tobago
-
 Tunisia
-
 Turkey
-
 UAE
UAE
-
 Uganda
-
 Ukraine
-
 United Kingdom
-
United States
-
 Uruguay
-
 Uzbekistan
-
 Venezuela
-
 Vietnam
-
 Yemen
Yemen
-
 Zambia
-
 Zimbabwe
- Forex
- Crypto












