
Jupiter: weak technicals and DeFi risk questions led to a 7.18% daily gain

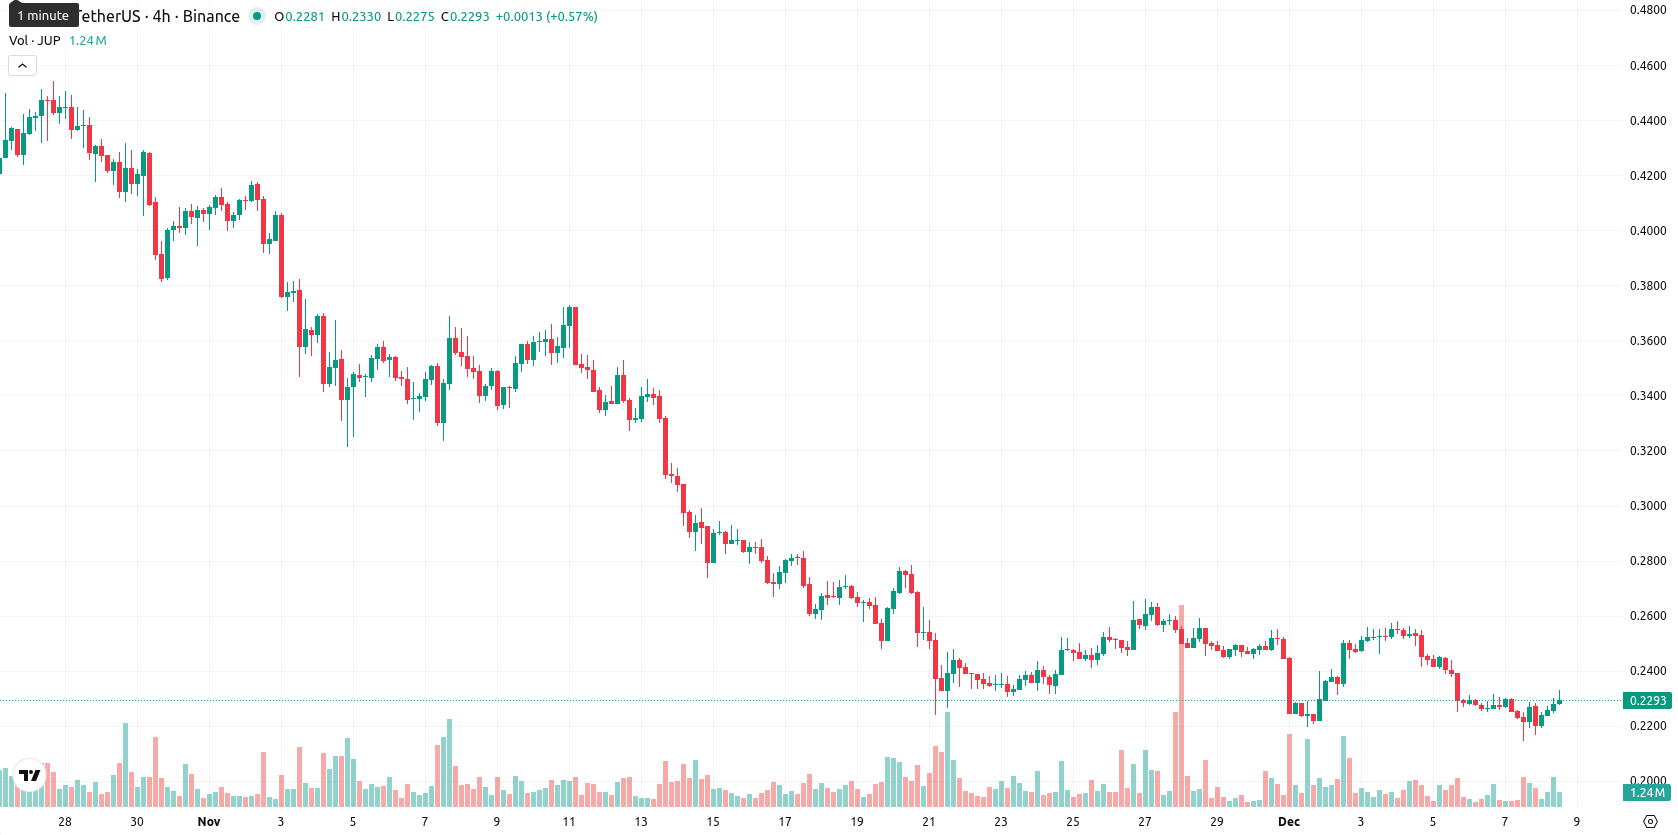
Jupiter (JUP) is currently trading at $0.2313, which remains below the MA-20 ($0.2450), MA-50 ($0.3149), and MA-200 ($0.4409), indicating ongoing short-, medium-, and long-term bearish pressure. The nearest dynamic resistance is the Ichimoku Kijun level at $0.2835, while immediate support sits just above recent intraday lows near $0.2192.
Highlights
- Jupiter Lend's COO admitted past claims of 'zero contagion risk' were inaccurate and confirmed asset rehypothecation within Solana's lending vaults.
- Public concerns, particularly from Kamino Finance, prompted clarification about asset isolation in Jupiter Lend’s vaults and increased scrutiny over risk disclosures.
- The Solana Foundation president called for greater collaboration and transparency in DeFi lending practices following the incident involving Jupiter Lend.
Asset rehypothecation concerns drive calls for DeFi transparency
Jupiter Lend, a protocol within the Jupiter ecosystem on Solana, faced heightened scrutiny regarding its lending vault risk disclosures after its COO acknowledged previous statements about 'zero contagion risk' were inaccurate and confirmed rehypothecation of assets does occur. This clarification came after public concerns raised by competitor Kamino Finance about the nature of asset isolation within Jupiter Lend’s vaults. The situation prompted the Solana Foundation president to call for increased collaboration and transparency in DeFi lending practices related to Jupiter.
Oversold signals persist as intraday buying meets dominant sellers
Momentum signals on the daily chart remain weak, with MACD and ADX pointing to persistent downside and sellers maintaining control. Both RSI (31.3) and CCI (–167) emphasize oversold territory, but Stoch RSI is neutral and BBP stays negative, signaling sellers' dominance despite today’s 7.18% gain. There was a small opening gap to the upside; the current price hovers near today’s high, reflecting high intraday volatility and strength toward session highs. While intraday oscillators show some buying attempts, persistent bearish momentum creates a notable divergence between short-term buying and broader downward pressure.
Low breakout odds as price likely to consolidate below resistance
For the next week, the expected trading range is $0.2100 – $0.2450, aligning with the current price and typical short-term volatility. The probability of a further price rise is very low (less than 20%), so a decline remains much more likely. Baseline scenario is continued sideways consolidation around $0.23. A bullish scenario would require a break above the Kijun resistance at $0.2835, targeting higher levels, while a decisive fall below $0.2190 could open up space toward the lower end of the weekly range.
Last time, analysts noted that Jupiter was trading well below all major moving averages, with persistent downside momentum and key technical indicators such as MACD and ADX signaling a sustained downtrend. Momentum remains negative with RSI approaching oversold territory, while bullish momentum is absent below Ichimoku resistance and high volatility threatens fragile support in the $0.20–$0.22 zone.


-
 Afghanistan
-
 Albania
-
 Algeria
-
 Angola
-
 Argentina
-
 Armenia
-
 Australia
-
 Austria
-
 Azerbaijan
-
 Bahamas
-
 Bahrain
-
 Bangladesh
-
 Belarus
-
 Belgium
-
 Bolivia
-
 Botswana
-
 Brazil
-
 Brunei
-
 Bulgaria
-
 Cambodia
-
 Cameroon
-
 Canada
-
 Chile
Chile
-
 China
China
-
 Colombia
-
 Congo
Congo
-
 Costa Rica
-
 Cote d'Ivoire
-
 Croatia
-
 Cuba
Cuba
-
 Cyprus
-
 Czechia
-
 DR Congo
-
 Denmark
-
 Dominican Republic
-
 Ecuador
-
 Egypt
Egypt
-
 El Salvador
-
 Estonia
-
 Eswatini
-
 Ethiopia
-
 Finland
-
 France
-
 Georgia
-
 Germany
-
 Ghana
Ghana
-
 Greece
-
 Haiti
Haiti
-
 Hong Kong
-
 Hungary
-
 India
India
-
 Indonesia
-
 Iran, Islamic republic
-
 Iraq
Iraq
-
 Ireland
-
 Israel
-
 Italy
Italy
-
 Jamaica
-
 Japan
Japan
-
 Jordan
-
 Kazakhstan
-
 Kenya
Kenya
-
 Korea
Korea
-
 Kuwait
-
 Kyrgyzstan
-
 Laos
Laos
-
 Latvia
-
 Lebanon
-
 Lesotho
-
 Libya
Libya
-
 Lithuania
-
 Luxembourg
-
 Madagascar
-
 Malaysia
-
 Malta
Malta
-
 Mauritius
-
 Mexico
-
 Moldova
-
 Mongolia
-
 Montenegro
-
 Morocco
-
 Mozambique
-
 Myanmar
-
 Namibia
-
 Nepal
Nepal
-
 Netherlands
-
 New Zealand
-
 Nigeria
-
 North Macedonia
-
 Norway
-
 Oman
Oman
-
 Pakistan
-
 Palestine
-
 Panama
-
 Papua New Guinea
-
 Paraguay
-
 Peru
Peru
-
 Philippines
-
 Poland
-
 Portugal
-
 Puerto Rico
-
 Qatar
Qatar
-
 Reunion
-
 Romania
-
 Rwanda
-
 Saudi Arabia
-
 Serbia
-
 Singapore
-
 Slovakia
-
 Slovenia
-
 Somalia
-
 South Africa
-
 Spain
Spain
-
 Sri Lanka
-
 Sweden
-
 Switzerland
-
 Syria
Syria
-
 Taiwan
-
 Tajikistan
-
 Tanzania
-
 Thailand
-
 Trinidad and Tobago
-
 Tunisia
-
 Turkey
-
 UAE
UAE
-
 Uganda
-
 Ukraine
-
 United Kingdom
-
United States
-
 Uruguay
-
 Uzbekistan
-
 Venezuela
-
 Vietnam
-
 Yemen
Yemen
-
 Zambia
-
 Zimbabwe
- Forex
- Crypto
